Reader Beware: Any blog post tagged as “Data Driven David” may not be as related to marketing as most of my content. I truly love data and love it even more when it is well visualized and wrapped in a great story — now, that’s good marketing.
Since 2013, I’ve been tracking every book I’ve read in Goodreads. It’s been a fun way to look back on years of reading, especially since probably 80–90% of what I pick up is business-related, usually focused on marketing. In this post, I’m sharing some of my favorite charts and stats that highlight my reading habits over time. Whether you’re curious about how many books I’ve tackled or how many pages I’ve turned, you’ll find the details here.
If you’re interested, I’ve also put together a few Pinterest boards showcasing the books I’ve rated five stars across different genres:
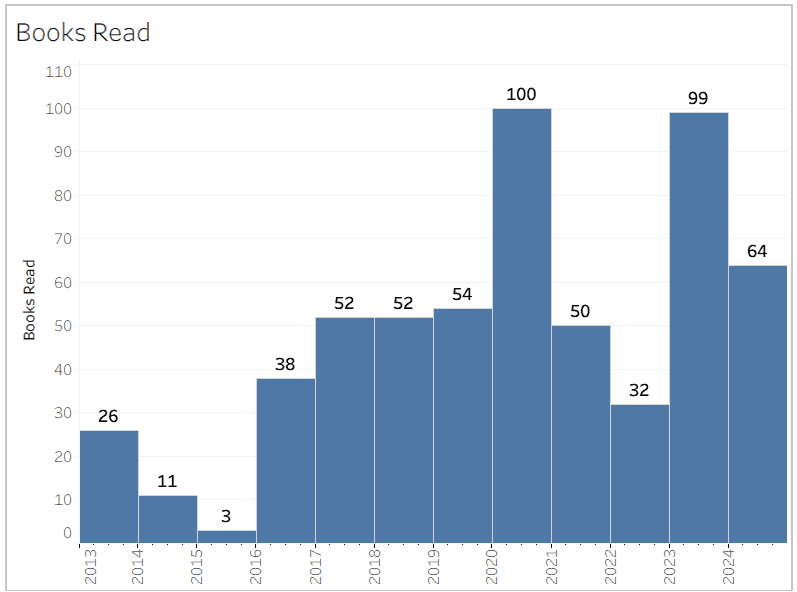
Despite what the chart below shows, I know I’ve reached my goal of reading 100 books in a year twice. My oldest daughter would probably dismiss this achievement since most of them were audiobooks.
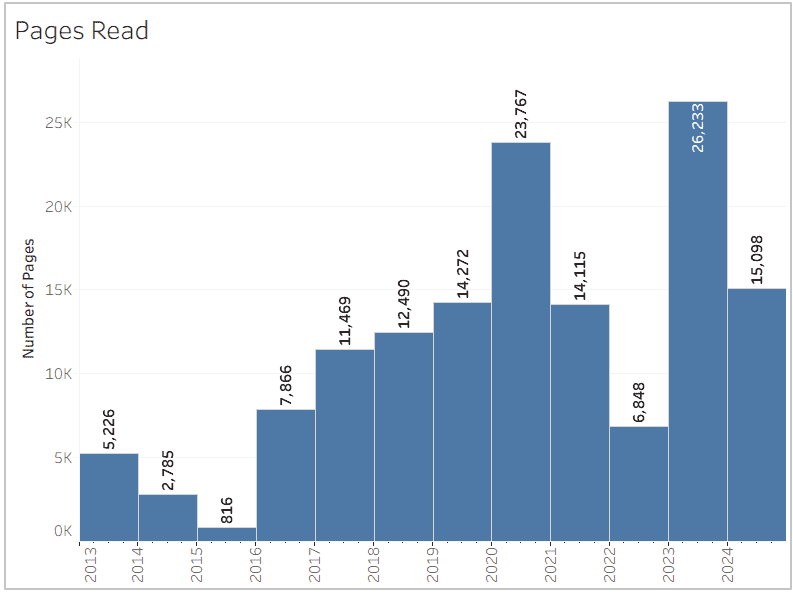
This next chart is similar, but instead of showing the number of books read, it tracks the number of pages. The data isn’t perfectly accurate because some books might be missing page counts, or the counts themselves might be incorrect, but most of the time it’s fairly reliable. Since I read a lot of business and religious books, many of them are under 200 pages. I considered combining this chart with the first one using a dual axis, with one as a line chart and the other as a bar graph. However, too many of the numbers overlapped and made the visual messy and confusing, even though it would have taken up less space than having two separate charts.
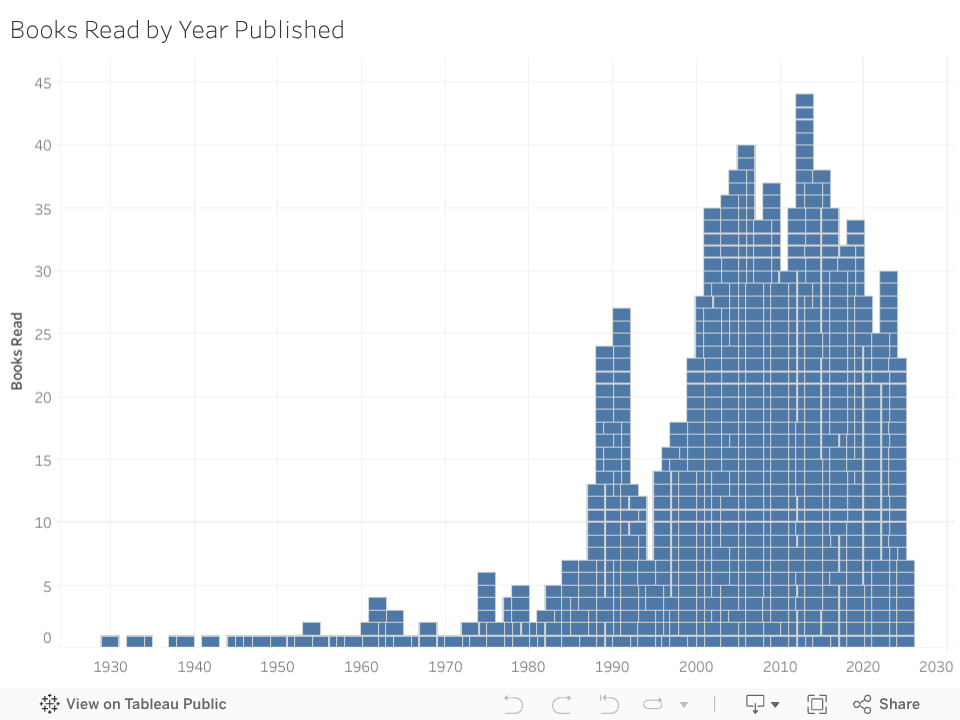
To date, I’m getting close to having read 1,100 books, and many of those were read before I started tracking in 2013. For the following chart, you can hover over any of the boxes by the year the book was published to see the book title, author, and my rating (if available). Earlier entries often lack ratings. This interactive chart is one of the great aspects of using Tableau.