
Last updated March 2026
Top Three Quotes
- “Getting data does not mean you get insight.”
- This line punctures the assumption that collecting more data automatically creates value.
- “Data are not valuable in and of themselves. You have to interact with the data in a particular way to get any insight from it.”
- The core thesis of the book: value comes from how you use data, not from its volume.
- “A KPI without a target is just a metric.”
- A sharp reminder that measurement must be tied to expectations and decisions, not dashboards.
Book Theme
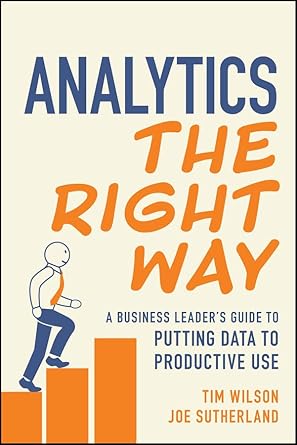
The central theme of Analytics the Right Way is that organizations only get value from data when they use it deliberately to support decision-making and operations—through three distinct but connected uses of data: performance measurement, hypothesis validation, and operational enablement.
Why You Should Read This Book
- If you feel “data rich but insight poor,” this book explains why that happens and gives you a concrete way out.
- It translates rigorous causal thinking and statistical reasoning into practical language for executives, managers, and product leaders.
- It offers a simple, memorable framework you can use to align analytics teams, business stakeholders, and technology investments around real business value instead of “big table mentality.”
- It is grounded in real client stories and vignettes that mirror the messy situations leaders actually face.
Key Ideas and Arguments Presented
- More data is not the same as more insight.
- The shift from “data desert” to “data deluge” created a belief that data itself is valuable, like oil, when in reality it is worthless without refinement and theory.
- Four common misconceptions about data distort how organizations invest.
- The book challenges four beliefs: that enough data can eliminate uncertainty, that data must be comprehensive to be useful, that data are inherently objective, and that democratizing access automatically makes an organization data-driven.
- Decision-making is about minimizing regret under uncertainty, not finding certainty.
- Good decisions systematically reduce regret given inevitable uncertainty, rather than pretending uncertainty can be removed.
- The “potential outcomes” framework clarifies causality.
- Potential outcomes and counterfactuals help leaders think clearly about what would have happened under different choices, grounding causal claims in a simple mental model.
- There are three fundamentally different ways to use data.
- Performance measurement, hypothesis validation, and operational enablement are distinct business activities that must be approached differently.
- Performance measurement should be driven by “two magic questions.”
- Start with “What are we trying to achieve?” and “How will we know if we’ve done that?” before defining KPIs, targets, and dashboards.
- Hypotheses must be explicit, actionable, and managed as a portfolio.
- The book uses a simple “Idea, Theory, Action” template and a hypothesis library to turn scattered ideas into an organized pipeline of tests.
- Not all evidence is equal: the ladder of anecdotal, descriptive, and scientific evidence.
- Leaders should match the evidence-gathering method to the cost and importance of the decision, rather than defaulting to dashboards or experiments.
- Descriptive and scientific analyses have predictable pitfalls.
- Unit of analysis errors, omitted variables, time effects, selection bias, and confounding can all mislead decisions if not handled carefully.
- Operational enablement turns validated hypotheses into scalable business logic and automation.
- Trade secrets and mechanisms discovered through hypothesis validation can be encoded into rules, models, and AI systems with appropriate human oversight.
Book Outline
- Chapter 1: Is This Book Right for You?
- The Digital Age = The Data Age
- What You Will Learn in This Book
- Will This Book Deliver Value?
- Chapter 2: How We Got Here
- Why common misconceptions about data hurt our ability to draw insights.
- Exploration of four major misconceptions, including the “data is the new oil” analogy.
- Chapter 3: Making Decisions with Data – Causality and Uncertainty
- Decision-making under uncertainty, minimizing regret, and introducing the potential outcomes framework.
- Chapter 4: A Structured Approach to Using Data
- Chapter 5: Making Decisions Through Performance Measurement
- Why “What are your KPIs?” is the wrong starting question.
- The two magic questions and methods for setting targets and using dashboards effectively.
- Chapter 6: Making Decisions Through Hypothesis Validation
- Framework for articulating, prioritizing, and tracking hypotheses in a hypothesis library.
- Chapter 7: Hypothesis Validation with New Evidence
- Introduction to the ladder of evidence: anecdotal, descriptive, and scientific.
- Chapter 8: Descriptive Evidence – Pitfalls and Solutions
- How to avoid common mistakes in historical and descriptive analysis.
- Chapter 9: Pitfalls and Solutions for Scientific Evidence
- Selection bias, confounding, and the essentials of controlled experimentation.
- Chapter 10: Operational Enablement Using Data
- The factory metaphor, trade secrets, automation costs, and the role of machine learning and AI.
- Chapter 11: Bringing It All Together
- How the three uses of data interconnect, plus guidance on communication, technology, and decision-making.
Key Takeaways
- Collecting more data does not solve business problems; refining data with clear theory and purpose does.
- Leaders should treat uncertainty as inevitable and focus on minimizing regret, not chasing impossible certainty.
- Every use of data should clearly fall into one of three categories: performance measurement, hypothesis validation, or operational enablement.
- Performance measurement must start from clearly stated goals and targets; otherwise, dashboards become expensive wallpaper.
- Actionable insight requires explicit hypotheses, documented as a portfolio, with methods and levels of evidence appropriate to the stakes.
- Descriptive and scientific analyses are powerful but fragile; careless design and bias can systematically mislead decisions.
- Operational enablement is where analytics scales—turning tested mechanisms into rules and models embedded in processes and products.
- The greatest value arises when all three uses of data operate in unison, like sections of an orchestra working from the same score.
Key Techniques
- The Two Magic Questions (Performance Measurement)
- 1) What are we trying to achieve? 2) How will we know if we’ve done that?
- KPI Design with Explicit Targets
- KPIs only become meaningful when paired with target values and timelines.
- Hypothesis Formulation Template (Idea – Theory – Action)
- “We believe [Idea] … because [Theory] … If we are right, we will [Action].”
- Hypothesis Library and Life Cycle Management
- Document, prioritize, and track hypotheses from ideation through validation and archival.
- Evidence Ladder and Method Selection
- Choose between anecdotal, descriptive, and scientific evidence based on decision cost and importance.
- Bias and Pitfall Checklists
- Use simple checks and causal diagrams to guard against unit-of-analysis errors, omitted variables, and selection and confounding bias.
- Operational Enablement Factory Model
- View data-driven operations as a factory with defined inputs, mechanisms, outputs, and levels of automation and human oversight.
Author’s Qualifications
- Tim Wilson
- Veteran analytics practitioner who built and led analytics practices at multiple agencies, consulted with Fortune 500 firms, co-founded the consultancy facts & feelings, and co-hosts the Analytics Power Hour podcast.
- Holds a BS from MIT and an MBA from the University of Texas at Austin.
- Dr. Joe Sutherland
- Director of the Emory Center for AI Learning and principal investigator in the US AI Safety Institute Consortium.
- Former executive at Amazon and Cisco, founder of two AI/fintech startups, and published researcher in machine learning and AI.
- Holds a PhD, MPhil, and MA from Columbia University.
Comparison to Similar Books
- Analytics the Right Way is less about algorithms than Data Science for Business and more about how leaders should structure decisions and analytics work.
- Compared with books like Naked Statistics or The Signal and the Noise, it focuses on operational frameworks rather than statistical intuition alone.
- Relative to Analytics at Work or Competing on Analytics, it dives deeper into causal reasoning, experimentation, and the distinction between measurement, testing, and operationalization.
- Versus typical “AI for business” titles, it is more skeptical of hype and more explicit about costs, governance, and when simple approaches beat complex models.
Target Audience
- Senior business leaders and executives who sponsor analytics, AI, or data initiatives.
- Marketing, product, and digital leaders overwhelmed by dashboards but underwhelmed by insight.
- Analytics, data science, and BI leaders seeking a shared language with business stakeholders.
- Operations and customer-experience leaders embedding data into processes and automation.
- Strategy and innovation teams building AI-first or data-first offerings.
- Consultants and agency partners looking for a clearer playbook for delivering value, not just reporting.
- Non-technical managers who want to become better consumers of analytics and experimentation.
Critical Response to the Book
Analytics the Right Way is a very recent book, so broad external critical reception is still emerging, but it reflects the authors’ well-established perspectives in the analytics and AI community and even “measures” its own impact by asking readers to rate each chapter against clear performance goals.
One Sentence Takeaway
Real business value from data comes not from hoarding it, but from using a clear framework to measure performance, validate hypotheses, and embed proven mechanisms into operations so leaders can make better decisions under uncertainty.

