Analytics

Graph showing digital marketing traffic sources with metrics for direct, organic, referral, and social media channels.

Opticks Review: Protect Your Ad Budget From Fake Clicks, Fake Leads, and Bot Traffic

Reading Time: 8 minutes

Opticks is a traffic quality and click fraud prevention platform that helps marketers identify invalid traffic across paid, organic, referral, direct, and emerging AI-driven sources. I tested it on MarketingWithDave.com to see how useful the data and insights were in practice.

The short version: Opticks gave me more visibility into traffic quality than I expected. The biggest value was not simply seeing a fraud percentage. It was being able to break that traffic down by source, channel, and behavior so I could better understand where my website traffic was coming from and how much of it deserved a closer look.

Check Opticks deal on AppSumo

Affiliate disclosure: If you purchase through my link, I may earn a small commission at no additional cost to you. I only share tools I have used myself.

The 30-Second Decision

Opticks is a strong fit for marketers, agencies, and business owners who want better visibility into traffic quality. If you are spending money on paid search or paid social, it can help you identify patterns that may be wasting budget. If you care about analytics accuracy, it can also help you understand how much questionable traffic may be influencing your reporting.

Opticks adds a traffic quality layer to your analytics and advertising data, helping you better understand which visits appear legitimate, suspicious, or potentially invalid.

My Scorecard
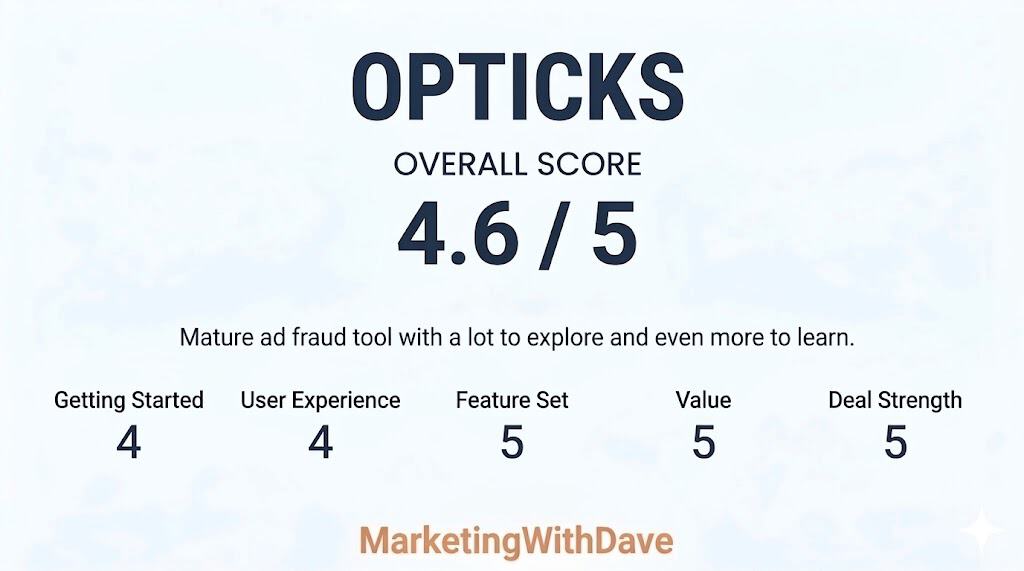
Opticks fraud detection tool interface showing an overall score of 4.6 out of 5, highlighting its effectiveness for fraud analysis and risk management in digital marketing.

Opticks earned high marks for feature depth, value, and overall maturity. Compared to many AppSumo launches that still feel early or experimental, this felt like a substantially more developed platform with meaningful analytics and investigation capabilities already in place.

The main reason this was not a perfect score comes down to onboarding and interpretation. Some workflows, classifications, and filtering options took real effort to fully understand, and additional getting started guidance or educational resources would make the platform more approachable for new users.

See how I rate software tools

Why I Wanted to Test Opticks

I have tested fraud prevention tools before, and one of the hard questions in this category is whether the ad platforms are already handling the problem. Google, for example, has its own invalid click detection and may issue credits when it identifies invalid activity. That matters.

But that still leaves a practical gap for advertisers. Even if some invalid activity is filtered or refunded later, marketers are often left with limited visibility into what happened, which channels were affected, and whether certain traffic sources deserve closer inspection.

That is what made Opticks interesting to me. I was less interested in a scary bot story and more interested in whether the tool could help me understand my own traffic better.

My Setup Experience

Setup was straightforward. Opticks can be installed manually or through Google Tag Manager, and I used Google Tag Manager because that fits how I manage most marketing and analytics tags.

Once installed, the platform began collecting traffic data quickly. I did not feel like I had to fight the setup process before getting value from the tool. That matters because traffic quality software can easily become something people buy, install halfway, and never fully use.

Note: Screenshots were captured during different stages of testing and may represent different date ranges. They are included to illustrate platform capabilities rather than compare identical datasets.

Graph showing legitimate traffic at 65.73% and invalid traffic at 31%, highlighting the importance of protecting ad budgets from fake clicks and bot traffic.

What Surprised Me Most

The first number that caught my attention was not tied to a paid campaign. It was the overall traffic quality view. In the screenshot I captured, Opticks showed 65.73% legitimate traffic and 31% invalid traffic.

That does not automatically mean 31% of my business opportunity was fake, and it does not mean every invalid visit requires immediate action. But it does change how you think about analytics. Even on a website that is not running large paid campaigns at the moment, there can still be a meaningful amount of traffic noise.

This is where Opticks became more useful than I expected. It was not just telling me that invalid traffic exists. It was helping me see where that traffic was showing up.

My Three Favorite Opticks Features

1. Traffic source visibility

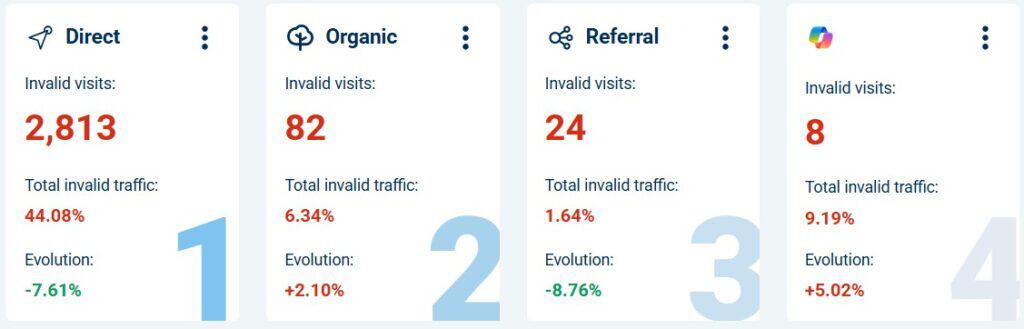
The most useful part of Opticks for me was the ability to look at invalid traffic by source and channel. In one view, I could see direct traffic, organic traffic, AI-related traffic, social sources, and other providers broken out separately.
Graph showing digital marketing traffic sources with metrics for direct, organic, referral, and social media channels.

This is also where judgment matters. A channel with one or two visits can show a dramatic percentage, but that does not mean you should immediately draw a big conclusion. A small sample size can make a number look more important than it is.

That is one of the things I appreciated about using Opticks. It gave me more visibility, but it also reminded me not to get emotional about every red number. The real value is in spotting patterns, then checking whether the volume and context support action.

2. Provider and channel filtering

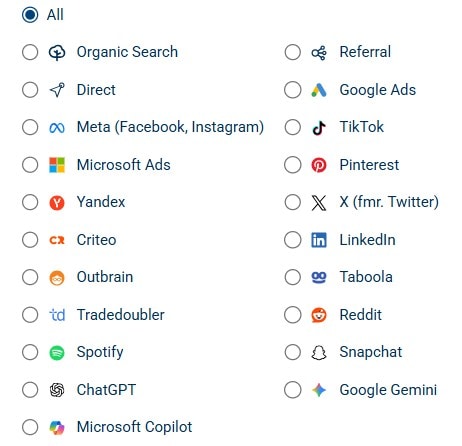
Opticks is not limited to one advertising platform. The provider filters include common paid media platforms, organic search, referral traffic, social networks, and newer AI-related sources like ChatGPT, Google Gemini, and Microsoft Copilot.
Screenshot of various digital marketing platform icons including Google Ads, Facebook, TikTok, LinkedIn, and others, related to ad traffic and campaign management.

Beyond the high-level traffic summaries, Opticks also made it easy to investigate traffic patterns using a wide range of dimensions and filters. I could segment traffic by campaign, keyword, placement, traffic channel, referring source, and other variables depending on what I wanted to analyze.

That matters because traffic quality is no longer just a Google Ads problem. Marketers now get traffic from search, social, referral websites, AI tools, content platforms, and direct visits that may not be as clean as they appear in standard analytics reporting.

Seeing those sources side by side makes the platform more useful for modern traffic analysis. It helps answer a better question than “Do I have fake clicks?” The better question is, “Which sources deserve more trust, and which ones deserve a closer look?”

3. Segmentation that helps you investigate

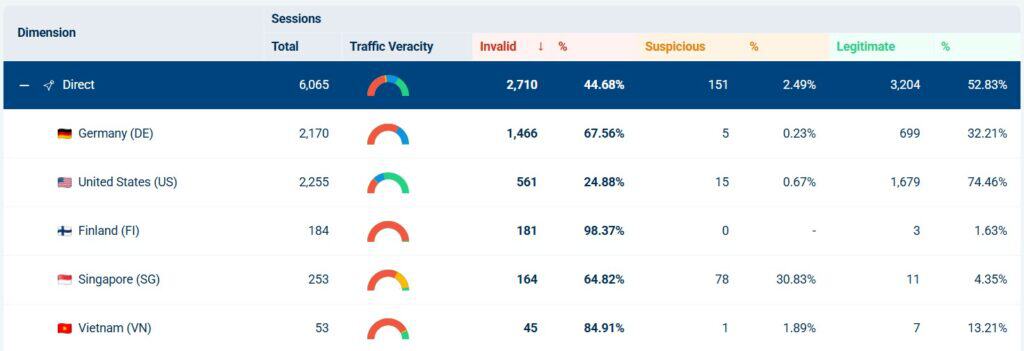
The referral breakdown was one of the clearest examples of why Opticks is useful. I could filter into referral traffic and see sessions, invalid visits, suspicious visits, legitimate visits, and web page views in the same table.
Graph showing traffic verification and suspicious activity for different countries, highlighting the importance of ad fraud protection.

That is much more helpful than a single invalid traffic percentage. A top-level number tells you something may be happening. Segmentation helps you understand where it is happening.

For example, if a referral source consistently sends legitimate visits, that is useful to know. If another source sends mostly invalid or suspicious activity, that deserves investigation. This is where Opticks becomes practical instead of theoretical.

Check Opticks deal on AppSumo

What Opticks Helped Me Understand Better

Opticks helped me separate traffic volume from traffic quality. Those are not the same thing.

Standard analytics tools are good at showing traffic totals, engagement, conversions, and attribution paths. But they do not always make it obvious whether part of that traffic should be trusted in the first place.

Opticks gave me another lens. Instead of only asking which channel brought traffic, I could also ask how much of that traffic appeared legitimate, suspicious, or invalid.

That may sound simple, but it changes how you evaluate marketing performance. A source that sends a lot of traffic is not automatically valuable. A source that sends less traffic but cleaner visits may be more useful than it first appears.

Where You Still Need Judgment

Opticks gives you better visibility, but it does not remove the need to interpret the data carefully.

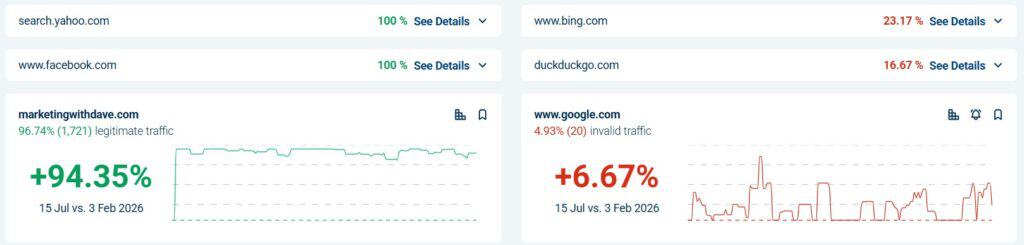
Small sample sizes can distort percentages. A source with one or two visits can look alarming if all of them are flagged. That does not necessarily mean the channel is bad. It means you need more context before making a decision.

Bot and invalid traffic labels can also require interpretation. Some automated traffic is clearly unwanted. Other activity may come from tools, crawlers, or systems you recognize. The platform helps surface the signal, but the marketer still needs to decide what the signal means.

That is not a criticism of Opticks as much as it is a reality of this category. Traffic quality data is useful, but it should be used with context.
Screenshot of website traffic analytics showing high traffic and positive growth for marketingwithdave.com, related to protecting ad budgets from fake clicks and bot traffic.

What Opticks Is Not

Opticks is not a Google Analytics replacement.

It is not a magic button that fixes weak campaigns.

It is not proof that every suspicious visit is costing you money.

It is not a reason to panic every time a source shows invalid traffic.

Opticks is best viewed as a traffic quality layer. It helps you identify where questionable traffic may be affecting your reporting, your paid campaigns, and your understanding of channel performance.

Who Opticks Is Best For

Opticks makes the most sense for businesses that are actively trying to understand and improve traffic quality.

It is especially relevant for advertisers running paid search, paid social, or lead generation campaigns where invalid traffic can quietly affect cost, conversion rates, and reporting confidence.

It is also useful for agencies that need a clearer way to monitor traffic quality across multiple sources. The ability to segment traffic by channel, provider, referral source, and campaign makes it easier to investigate patterns without relying only on ad platform reporting.

For a tiny website with very little traffic and no paid campaigns, Opticks may be more interesting than necessary. But for marketers spending meaningful money to acquire traffic, the visibility can be valuable quickly.

Pros and Cons

What I LikedWhat to Keep in Mind
Setup through Google Tag Manager was straightforward.The data still needs interpretation, especially with small sample sizes.
The dashboard made traffic quality easy to understand quickly.Not every invalid or suspicious signal should trigger immediate action.
Provider and channel filters made the tool feel broader than paid search.Some bot or source labels may require additional context before deciding what to do.
Referral and source breakdowns made the data more actionable.This should complement your analytics and ad platform reporting, not replace it.
The product felt mature and practical rather than experimental.The value increases as your traffic volume and paid media spend increase.

AppSumo Pricing

Opticks is currently available on AppSumo as a lifetime deal. Since AppSumo promotions are only available for a limited time and pricing or license tiers can change, I recommend checking the current listing before making a decision.

When evaluating the different license tiers, focus on your expected traffic volume, the number of websites you plan to monitor, and whether you’ll benefit from features such as lead protection, automated Google Ads IP exclusion, or advanced reporting. If you’re investing heavily in paid advertising or managing multiple websites, choosing the right tier upfront may save you from ne.eding to upgrade later.

Bottom Line

Opticks gave me a clearer view of traffic quality than I expected. The platform was easy to set up, and the dashboards were useful without being overwhelming, and the source-level breakdowns made the data feel practical.

The biggest takeaway from my testing was that invalid traffic is not only a paid search issue. Even direct, referral, organic, and newer AI-related sources can warrant a closer look. That does not mean every red number should cause panic. It means marketers need better visibility before making decisions.

For businesses spending meaningful money on traffic acquisition, Opticks is a strong addition to the marketing stack. It helps you ask better questions about your traffic, spot patterns you might otherwise miss, and understand which sources may deserve more trust.

Check Opticks deal on AppSumo

This content is for educational purposes and reflects my experience, review of the product, and current publicly available deal information. Always evaluate tools based on your specific business needs, goals, and workflows before making a decision.

Looking for more marketing software reviews? See my full list of marketing tools and software I recommend.

Opticks Review: Protect Your Ad Budget From Fake Clicks, Fake Leads, and Bot Traffic Read More »
A detailed analysis of the image content is not possible, but based on the context provided, here are SEO-optimized texts:.

10 Things Marketers Need to Know About Chrome DevTools

Reading Time: 7 minutes

Chrome DevTools can look like developer territory, but marketers do not need to be developers to use it. If you have ever wondered whether a pixel fired, why attribution dropped, or why a form behaves differently for different visitors, DevTools gives you browser-level evidence.

If you have worked in Google Tag Manager, Google Analytics 4, paid media platforms, or website analytics tools before, you already have enough context to use most of what is covered here.

That is the important shift. You are not guessing from a dashboard. You are looking at what the browser actually requested, received, stored, blocked, or warned about.

How to Open Chrome DevTools

The friendliest way to start is the one many marketers already use.

Option 1: Right-click and Inspect.

Right-click anywhere on the web page and choose Inspect. This opens DevTools directly inside Chrome.

Option 2: Use a keyboard shortcut

Windows: Ctrl + Shift + I or F12.

Mac: Cmd + Option + I.

The Simple Mental Model

Think of DevTools as four lenses. Each one answers a different marketing question.

Network

Did the tag, pixel, form, script, or redirect actually happen.

Console and Issues

Did Chrome detect an error, warning, blocked script, cookie issue, or mixed content problem.

Application

Were cookies, local storage, consent settings, or other browser storage values created correctly.

Performance

Is the web page slow, unstable, or overloaded by scripts that hurt the visitor experience.

Two Rules Before You Start

First, open DevTools before you reproduce the problem. If you open it after the form submit, checkout step, or redirect, the evidence may already be gone.

Second, turn on Preserve log in the Network panel. Many marketing flows move from one web page to another. Preserve log keeps the request history from disappearing during that navigation.

10 Practical DevTools Checks for Marketers

These are the DevTools checks I would prioritize first. You do not need to learn every panel. You need to know which panel answers which marketing question.

1. Verify that a pixel or event actually fired

Start in Network.

Dashboards can lag, sample, or hide details. The Network panel shows whether the browser sent the request at all.

  1. Open DevTools and choose the Network panel.
  2. Turn on Preserve log.
  3. Reload the web page or perform the action, such as a form submit or purchase.
  4. Filter by a vendor domain or keyword such as collect, gtm, pixel, or doubleclick.
  5. Click the matching row and confirm it fired at the right time.

You may find that the event never fired, fired too early, fired too late, or fired more than once.

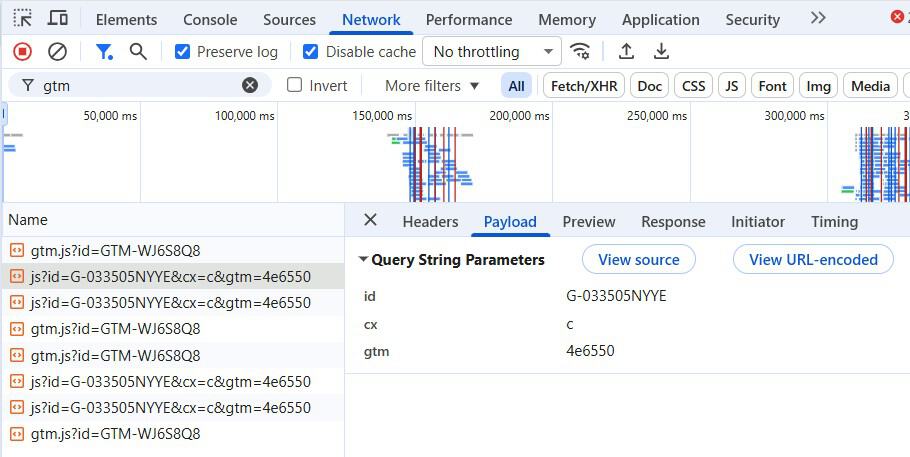
2. Confirm that the request payload has the right values

Start in Network, then check Headers and Payload.

Many tracking problems are not missing-hit problems. They are bad-data problems. The event may fire, but it may send the wrong value.

  1. Click the request that looks like your analytics or ad platform hit.
  2. Check the status code in Headers.
  3. Open Payload and review fields like event name, revenue, currency, product IDs, lead ID, or deduplication ID.
  4. Use the search box if you need to find one parameter quickly.

You may find that a purchase event fired, but revenue is missing or the wrong currency was sent.

A detailed analysis of the image content is not possible, but based on the context provided, here are SEO-optimized texts:.
Example of inspecting a request payload in Chrome DevTools. Many real analytics and conversion requests contain much richer data than this simple example, including event names, revenue values, IDs, and attribution parameters.

3. Identify what triggered a request

Start in the Network Initiator column.

This helps you route the issue. Is it a tag manager problem, a developer problem, a vendor script problem, or a consent problem.

  1. Find the request in Network.
  2. Look for the Initiator column.
  3. Open the request details if you need more context.
  4. Right-click the request and choose Copy as fetch or Copy as cURL if a developer asks for more detail.

You may discover that GTM loaded correctly, but a JavaScript error stopped the custom event from being pushed.

4. Debug redirects that strip UTMs or click IDs

Start in Network with Preserve log turned on.

Redirects can silently remove UTMs, gclid, msclkid, or referrer information. That can make attribution look broken even when the campaign was tagged correctly.

  1. Open Network and turn on Preserve log.
  2. Paste the full campaign URL into the address bar.
  3. Watch each redirect step in the request list.
  4. Confirm the final landing URL still includes the needed parameters.
  5. Repeat once with Disable cache checked.

You may find that the first redirect preserves UTMs, but a second redirect drops them.

5. Test like a first-time visitor

Start in Network and Application.

Your browser has history. It may have cached scripts, accepted cookies, or saved consent choices that a new visitor does not have.

  1. In Network, check Disable cache.
  2. Reload the web page while DevTools is open.
  3. For a cleaner test, go to Application and use Clear site data.
  4. Run the flow again and compare the result.

You may find that tracking works for returning visitors but fails before a new visitor accepts consent.

6. Find where a tag is installed or duplicated

Start in Search and Elements.

Tags may be injected by GTM, a consent platform, a plugin, a theme, or an old hardcoded snippet. Duplicate installs can inflate reporting.

  1. Use Global Search with Ctrl + Shift + F on Windows or Cmd + Option + F on Mac.
  2. Search for a container ID, pixel ID, vendor domain, or script name.
  3. Click a match to see where it appears.
  4. Use the Elements panel to see what is actually rendered in the browser.

You may find an old pixel snippet loading alongside the GTM-managed version.

7. Audit cookies, storage, and consent state

Start in Application and Issues.

Measurement often depends on cookies, consent state, local storage, and browser rules. If storage is wrong, attribution can break even when the event fires.

  1. Open Application.
  2. Check Cookies for the domain you are testing.
  3. Check Local Storage for consent-related keys.
  4. Review the Issues panel for cookie warnings.

You may see that the conversion request fired, but the identifying cookie was missing or blocked.

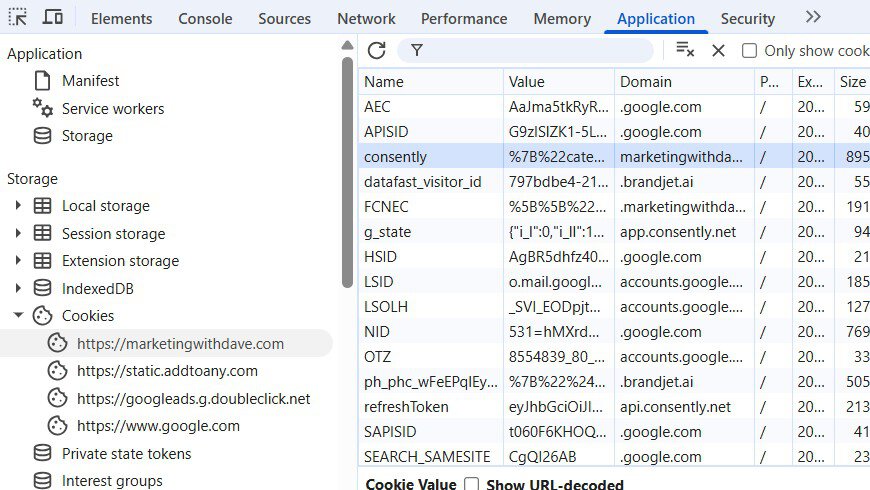
Screenshot of Chrome DevTools interface showing network activity and performance metrics for "Marketing with Dave" website, related to marketing and SEO insights.
The Application panel helps marketers inspect cookies, browser storage, consent settings, and other tracking-related data stored in the browser.

8. Catch JavaScript errors and browser warnings

Start in Console, Issues, and Security.

A single JavaScript error can stop a form, block an event, or prevent a tag from firing.

  1. Open the Console panel.
  2. Reload the web page and watch for red errors.
  3. Use Preserve log in Console if the flow navigates to another web page.
  4. Check Issues and Security for cookie problems, mixed content, or blocked resources.

You may find that a form submit fails because an unrelated script error stops the event from completing.

9. Simulate mobile and slower real-world conditions

Start in Device Mode, Network throttling, and Performance.

Your desktop connection is not your customer’s phone. Slower conditions expose problems that clean office testing misses.

  1. Toggle Device Mode with Ctrl + Shift + M on Windows or Cmd + Shift + M on Mac.
  2. Choose a mobile viewport.
  3. Throttle the network from the Network panel.
  4. Test landing, scrolling, CTA clicks, form submits, and checkout steps.

You may find that a widget or third-party script makes the web page feel fine on desktop but painful on mobile.

10. Find what is slowing the web page down

Start in Performance, Coverage, and Lighthouse.

Slow landing web pages are often caused by heavy scripts, layout shifts, blocking resources, or unused code.

  1. Open the Performance panel.
  2. Record a trace around the part of the experience that feels slow.
  3. Use Coverage to spot unused JavaScript and CSS.
  4. Use Lighthouse if you need a score that is easier to share with stakeholders.

You may find a layout shift pushing the CTA down, or a marketing library shipping unused code to every visitor.

Cheat Sheet: Problem to Panel

Marketing problem. Start here. What to look for.
Pixel or event not firing. Network. Request exists, timing, status code, and payload.
Wrong parameters or missing revenue. Network. Payload fields, event name, revenue, IDs, and request details.
Attribution drop after consent or privacy changes. Application and Issues. Cookie presence, consent state, storage values, and cookie warnings.
UTMs or click IDs missing on the final landing URL. Network. Redirect chain with Preserve log enabled.
Tag blocked or script errors. Console, Issues, and Security. JavaScript errors, blocked resources, mixed content, and browser warnings.
Landing web page feels slow on mobile. Device Mode and Performance. Mobile layout, throttling, heavy scripts, unused code, and Core Web Vitals signals.

What Is a HAR File and Why Developers Ask for One

A HAR file is an export from the browser’s Network panel. HAR stands for HTTP Archive. In plain English, it is a record of the requests and responses that happened while you tested a web page.

A HAR file can show redirects, request timing, status codes, headers, and other details that help a developer understand what happened in the browser. That is why it can be useful when a pixel does not fire, a redirect strips UTMs, a form fails, or a request returns an error.

Important: HAR files can contain sensitive information, including cookies, tokens, account IDs, email addresses, private URLs, and other data. A sanitized HAR means you review the file and remove sensitive information before sharing it with anyone else.

What to Send a Developer

Developers usually want the same thing you want: a faster fix. DevTools helps you give them evidence instead of a vague “it is broken” report.

  • Exact URL and whether it is production, staging, or a test environment.
  • Short numbered steps to reproduce.
  • Expected behavior versus actual behavior.
  • Timestamp, time zone, and whether you tested in an incognito window.
  • Chrome version, operating system, login state, and consent choice.
  • Sanitized HAR file from the Network panel, when appropriate.
  • Specific request row details, status code, and Copy as fetch or Copy as cURL if requested.
  • Console or Issues screenshots with Preserve log enabled if navigation is involved.

Image Checklist for Your DevTools Screenshots

For the most useful Network screenshot, capture the screen after a real action such as a form submit or purchase. Try to show Preserve log, Disable cache if relevant, the filter term, one highlighted request row, status code, type, size, time, and the Headers or Payload tab.

Before publishing, blur or crop anything sensitive such as email addresses, cookies, tokens, order IDs, account IDs, or private URLs.

Where to Start

Do not try to learn every panel at once. Start with one critical flow and build confidence from there.

  1. Pick one flow, such as a lead form, checkout, newsletter signup, or ad landing web page.
  2. Open DevTools before the test and turn on Preserve log.
  3. Run the flow once and look for the key analytics or ad request in Network.
  4. Check the Payload to confirm the important values are present.
  5. Save a sanitized HAR or screenshot so you have baseline evidence for future troubleshooting.

10 Things Marketers Need to Know About Chrome DevTools Read More »

404 Page Not Found Tracking in GA4: Capture Broken URLs and Referrers with GTM

Reading Time: 3 minutes

When traffic reaches a web page titled “Page not found” in Google Analytics 4, you know something went wrong, but you usually do not know much else.

Which URL was requested? Did the visitor come from your own website, another website, or bot traffic? Was it a real broken link or just noise?

That is the gap this setup solves. With a small Google Tag Manager and GA4 configuration, you can capture the attempted URL and referrer whenever a 404 web page loads. That gives you the context needed to diagnose the issue and decide what to do next.

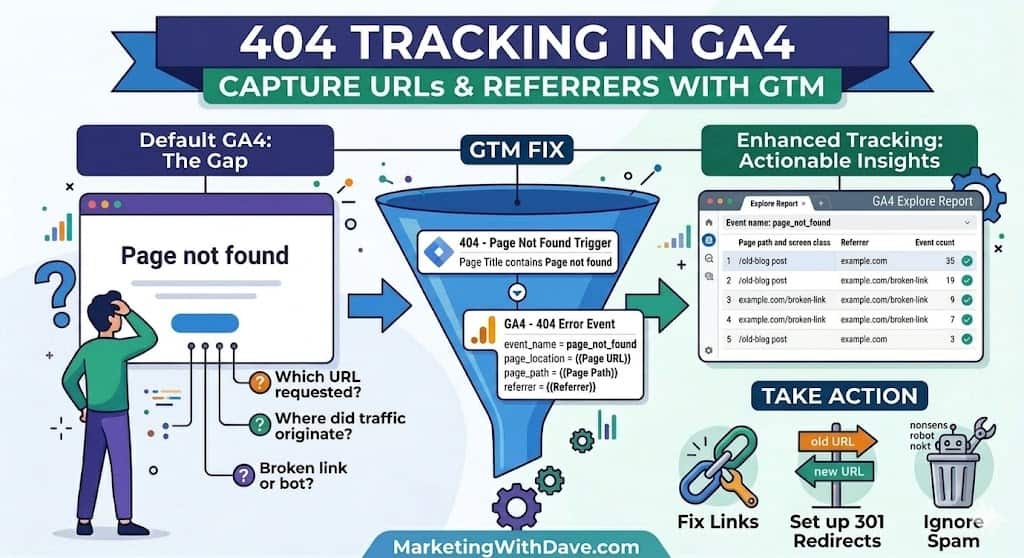
404 tracking in ga4 - capture urls and referrers with google tag manager

What this setup captures

This setup sends a custom GA4 event called page_not_found whenever a 404 web page loads.

Along with the event, it sends the full attempted URL, the requested path, and the referrer. That means you can see what the visitor tried to access and where they came from.

Instead of seeing only a generic “Page not found” title in your reports, you can see the actual destination that was requested.

Why better 404 tracking matters

Some 404s are real problems. They can reveal broken internal links, outdated destinations, or incorrect external links that cost traffic and hurt user experience.

Others are just noise, such as bots requesting junk URLs that never existed.

The goal is not to treat every 404 the same. The goal is to capture enough context to know which ones deserve action.

How to set up 404 tracking in Google Tag Manager

The first step is identifying your 404 web page condition. On many WordPress websites, the browser title contains the phrase “Page not found.” If that is true on your website, you can use it as your trigger condition.

If you do not already have a Page Title variable available, create one in Google Tag Manager as a JavaScript Variable using:

document.title

Next, create a new trigger in Google Tag Manager.

Name the trigger something like:

404 - Page Not Found

Set the trigger type to:

Page View

Choose:

Some Page Views

Then use this condition:

Page Title contains Page not found

That tells GTM to fire only when a 404 web page loads.

How to send the 404 event to GA4

After the trigger is in place, create a new GA4 Event tag in Google Tag Manager.

Name it something like:

GA4 - 404 Error

Use your existing GA4 configuration tag.

Set the event name to:

page_not_found

Then add these event parameters:

page_location = {{Page URL}}

page_path = {{Page Path}}

referrer = {{Referrer}}

Attach the 404 - Page Not Found trigger to the tag and publish the container.

At that point, GA4 will start receiving a dedicated 404 event with enough context to investigate what happened.

How to build the GA4 report

The easiest long-term approach is to build an Explore report in GA4 focused only on the page_not_found event.

Go to Explore and create a Free Form exploration.

Add these dimensions:

Event name

Page path and screen class

Add this metric:

Event count

Then apply a filter where:

Event name exactly matches page_not_found

This gives you a simple report showing which broken URLs are being requested most often.

Once data is flowing, add referrer-related dimensions if they are available in your property.

How to interpret the data

Once 404 tracking is live, the next step is deciding what kind of problem each broken URL represents.

If you see a clean-looking path that resembles a real article, category, or resource, that is often a legitimate issue. It may be an outdated internal link, a changed URL, or an old destination that still receives traffic.

If you see a bad path with an external referrer, that usually points to an incorrect backlink. In many cases, a redirect is the right fix.

If you see bizarre paths that never looked like real website content, especially with no meaningful referrer, that is often just spam or automated scanning. In those cases, the right action may simply be to ignore it.

What action you can take from this data

The value of better 404 tracking is that it gives you a short list of decisions instead of a vague warning.

If the broken URL is caused by a bad internal link, fix the source link.

If the URL used to exist and still gets meaningful traffic, consider a 301 redirect.

If the request comes from another website, decide whether the traffic is worth recovering with a redirect.

If the path is obvious junk, treat it as noise and move on.

Why this setup is worth it

Out of the box, GA4 can tell you that a 404 happened. This setup tells you what was requested and where it came from.

That makes it easier to fix broken internal links, recover traffic with redirects, and ignore junk requests that do not matter.

It is a small implementation, but it turns vague 404 reporting into something you can actually use.

404 Page Not Found Tracking in GA4: Capture Broken URLs and Referrers with GTM Read More »

categorizing referring domain data in ga4 using google tag manager 1

Categorizing Referring Domain Data in GA4 Using Google Tag Manager

Reading Time: 4 minutes

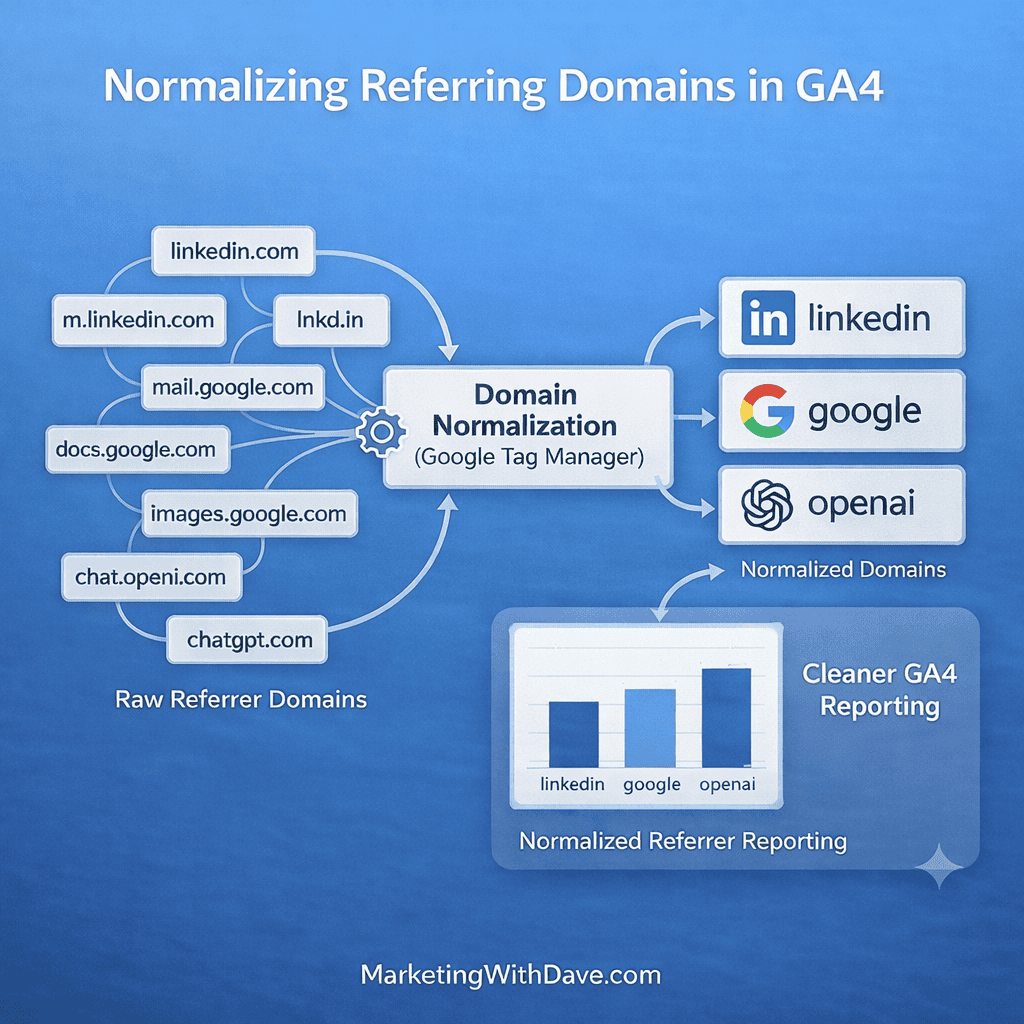
Google Analytics (GA4) provides useful traffic source reporting, but referring domain data can quickly become messy. The same platform may appear in multiple forms such as linkedin.com, www.linkedin.com, or lnkd.in. Google referrals may appear as google.com, mail.google.com, or docs.google.com.

When these variations are not cleaned up, referral reporting becomes fragmented. Instead of clearly seeing which platforms drive traffic, analytics reports fill up with dozens or even hundreds of inconsistent domains.

This article explains how to categorize referring domain traffic in GA4 using Google Tag Manager. The approach normalizes messy referrer values and assigns them to clear traffic categories such as social platforms, search engines, internal traffic, AI tools, or spam domains.

The result is much cleaner referral reporting and a much easier way to analyze where your traffic actually comes from.

The Problem With Referring Domain Data in GA4

Referring domains represent the website that sent a visitor to your website. In theory this sounds simple, but in practice the data can become messy very quickly.

One platform may appear under multiple domain variations. Mobile apps, redirect services, and shortened links can all generate slightly different referrer values. The result is fragmented reporting that makes it harder to compare traffic sources over time.

For example, LinkedIn traffic may appear under several variations.

linkedin.com
www.linkedin.com
lnkd.in

Each variation appears as a separate referrer in GA4, even though they all represent the same platform.

The same issue appears across many other platforms including Google, Pinterest, Medium, and social networks.

Normalization and Categorization Explained

This solution uses two related steps.

First, referring domains are normalized. This means multiple domain variations are cleaned into a single consistent value.

Second, those normalized values are categorized into meaningful traffic groups.

The workflow looks like this.

Raw referrer
→ Normalized domain
→ Traffic category

For example.

lnkd.in
→ linkedin
→ social

mail.google.com
→ google
→ search

marketingwithdave.com
→ internal
→ internal

startraffic.online
→ spam
→ spam

This process dramatically simplifies referral reporting.

Why Categorizing Referrers Is Valuable

GA4 already identifies traffic channels such as Organic Search, Social, and Referral. However, those channels do not always show which specific platform generated the visit.

Categorized referring domains allow you to see traffic at a much more meaningful level.

Instead of only seeing social traffic, you can more clearly separate traffic from platforms such as LinkedIn, Instagram, Pinterest, or X.

This is especially helpful if you promote content across multiple platforms and want to measure which ones actually drive visits.

It also allows you to quickly separate legitimate traffic from spam referrals or internal visits.

Categories Worth Tracking

A good first implementation should classify several common types of traffic.

Search engines such as Google, Bing, DuckDuckGo, and others.

Social platforms such as LinkedIn, Instagram, Pinterest, TikTok, Medium, Reddit, and X.

AI tools such as ChatGPT, Claude, and Perplexity. These platforms are increasingly appearing in referral data as AI assistants begin linking directly to websites.

Internal traffic coming from your own domain.

Spam domains that generate junk referrals.

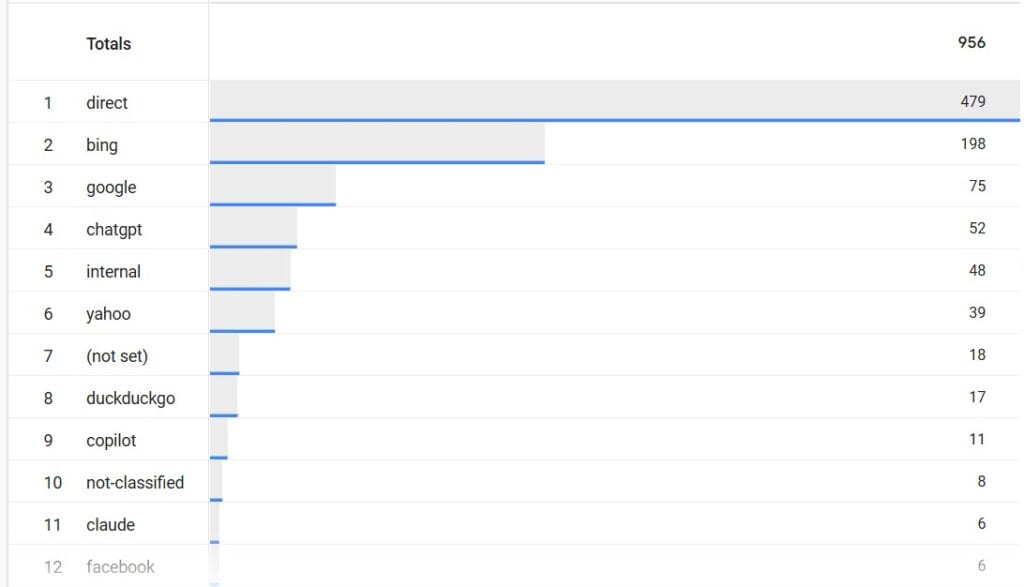
Any domain not yet reviewed should fall into a category called not-classified. This makes it easier to identify domains that need to be reviewed later.

When This Approach Is Especially Useful

This setup is particularly helpful if you publish content regularly across multiple platforms.

It is also valuable if you want to identify AI-generated traffic, remove spam domains from reports, or clearly separate internal traffic from real visitors.

If you build dashboards in Looker Studio or export traffic data to spreadsheets, normalized referrer categories make analysis much easier.

Creating the Referrer Normalization Variable in GTM

The normalization logic is implemented using a Custom JavaScript variable in Google Tag Manager.

Create a new variable using the Custom JavaScript variable type and paste the following script.

function() {
  var ref = document.referrer;

  if (!ref) return 'direct';

  var host = '';
  try {
    host = new URL(ref).hostname.toLowerCase();
  } catch (e) {
    return 'not-classified';
  }

  host = host.replace(/^www\./, '');

  if (host.indexOf('marketingwithdave.com') > -1) return 'internal';

  if (host.indexOf('google.') > -1) return 'google';
  if (host.indexOf('bing.com') > -1) return 'bing';
  if (host.indexOf('duckduckgo.com') > -1) return 'duckduckgo';

  if (host.indexOf('linkedin.com') > -1 || host.indexOf('lnkd.in') > -1) return 'linkedin';
  if (host.indexOf('facebook.com') > -1) return 'facebook';
  if (host.indexOf('instagram.com') > -1) return 'instagram';
  if (host.indexOf('pinterest.com') > -1 || host.indexOf('pin.it') > -1) return 'pinterest';
  if (host.indexOf('tiktok.com') > -1) return 'tiktok';
  if (host.indexOf('medium.com') > -1) return 'medium';
  if (host === 't.co' || host.indexOf('twitter.com') > -1 || host === 'x.com') return 'x-twitter';

  if (host.indexOf('chatgpt.com') > -1 || host.indexOf('chat.openai.com') > -1) return 'chatgpt';
  if (host.indexOf('claude.ai') > -1) return 'claude';
  if (host.indexOf('perplexity.ai') > -1) return 'perplexity';

  if (host.indexOf('startraffic.online') > -1) return 'spam';

  return 'not-classified';
}

Name the variable something descriptive such as JS – Referrer Normalized.

Adding the Variable to Your GA4 Tag

Open your GA4 Google Tag or page_view tag in Google Tag Manager.

Add a configuration parameter with the following values.

Parameter name: referrer_normalized
Value: {{JS – Referrer Normalized}}

This sends the normalized value to GA4 with each page view.

Test the implementation in GTM Preview mode before publishing.

Creating the GA4 Custom Dimension

After publishing the GTM changes, create a custom dimension in GA4.

Use the following settings.

Dimension name: Referrer Normalized
Scope: Event
Event parameter: referrer_normalized

This allows the normalized value to appear in GA4 reports and explorations.

Important GA4 Limitation

GA4 custom dimensions are not retroactive. Historical referral data will not be reprocessed.

The categorized values will only appear for traffic collected after the implementation goes live.

Expanding the Classification Over Time

Your first version does not need to classify every possible domain.

Start with the platforms you already know are important. Over time, review domains that appear under not-classified and add additional rules as needed.

This gradual approach allows the classification system to evolve alongside your traffic patterns.

Visualizing the Workflow

A simple diagram can help illustrate the process.

Raw Referrer
→ Normalized Domain
→ Traffic Category

This visual representation works well as a blog image and helps readers quickly understand how the transformation occurs.

Final Thoughts

Referring domain data in GA4 often becomes fragmented and difficult to analyze. Normalizing and categorizing referrer values provides a simple way to transform messy domain data into clear traffic insights.

With a small amount of logic in Google Tag Manager, referral traffic can be organized into meaningful categories that are much easier to analyze in GA4 dashboards and reports.

If you regularly share content across multiple platforms or want to better understand where your visitors originate, categorizing referring domain traffic is one of the most useful analytics improvements you can implement.

Categorizing Referring Domain Data in GA4 Using Google Tag Manager Read More »

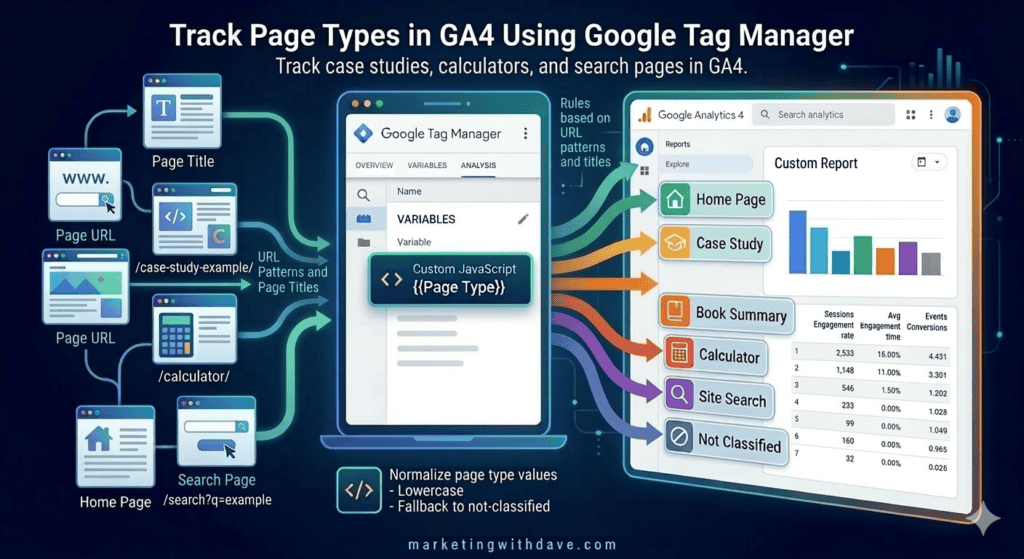
track page types in google analytics 4 using google tag manager

Track Page Types in Google Analytics 4 Using Google Tag Manager

Reading Time: 6 minutes

If you want better content analysis in Google Analytics 4, tracking just URLs is not enough. A list of individual web pages can tell you what got traffic, but it does not make it easy to understand which kinds of content are actually driving your website forward.

That is where page type tracking can help. Instead of only measuring individual URLs, you can classify each web page by format and send that value into GA4 as a custom parameter. This makes it possible to analyze performance by content type, such as case studies, book summaries, calculators, site search, the home page, and anything that does not yet fit into a defined bucket.

In my case, I used Google Tag Manager to identify page types based on URL patterns and page titles, then passed that value to GA4 using a custom parameter called page_type.

What page type tracking does

Page type tracking adds a structural content layer to your analytics. Instead of only seeing that a specific web page got traffic, you can now understand whether that traffic came from a case study, a calculator, a book summary, a home page visit, or some other kind of content.

Examples of page type values might include:

home-page
case-study
book-summary
calculator
site-search
404
not-classified

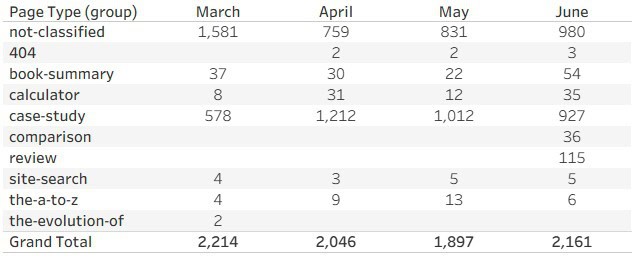
Once the custom dimension had been collecting data for a few months, I could finally analyze traffic by page type instead of individual URLs. Here’s what that report looks like on my own site.

Table showing page type data for March to June, including not-classified, 404, book-summary, calculator, case-study, comparison, review, site-search, the-a-to-z, the-evolution-of, and grand total.
Notice that “not-classified” is the largest bucket today. As I create more page type rules over time, I expect that category to continue shrinking.

Why page type tracking is useful in GA4

Once page type is available as a custom dimension, GA4 becomes much more useful for content analysis.

You can answer questions like:

  1. Which page types attract the most sessions?
  2. Which page types drive the strongest engagement?
  3. Which page types are most likely to bring in organic traffic?
  4. How much of my website still falls into a general not-classified bucket?

This becomes even more powerful when combined with topic tracking, because you can analyze both the format of the web page and the subject of the content.

Before you start

This walkthrough presumes:

1. You are using Google Tag Manager.

2. Your GA4 page_view event is firing through GTM.

3. Your website has consistent URL patterns or titles that can be used to identify different page types.

4. You want page types to be stable over time and mutually exclusive.

Why page type rules need to be precise

A page type should describe the format of the content, not the topic. For example, case study is a page type. Martech is a topic. Those are different things and should be tracked separately.

The goal is to give each web page one clear page type value. That keeps the classification stable and makes reporting easier to trust.

It is also important not to create too many page types too quickly. A small, meaningful set is usually better than trying to classify every edge case on day one.

Step 1: Define your page type values

Start by deciding which page types your website actually needs. In my setup, I used these values:

home-page
case-study
book-summary
calculator
site-search
404
not-classified

The first several values represent meaningful content structures. The final value, not-classified, acts as an intentional catch-all bucket.

Why not-classified matters

If no matching rule is found, the script returns not-classified.

This is not a mistake. It is a useful fallback. It gives you a deliberate “other” bucket so that uncategorized web pages do not get confused with GA4 system labels like not set. Over time, monitoring the percentage of sessions tied to not-classified can help you decide whether more page types are needed or whether the current taxonomy is already healthy.

Step 2: Create a Custom JavaScript Variable in Google Tag Manager

In GTM, create a new User-Defined Variable using the Custom JavaScript variable type.

Name it something like:

Page Type

Then use logic that checks the current URL path and page title to determine the correct page type.

Here is an example:

function() {

var path = window.location.pathname.toLowerCase();
var url = window.location.href.toLowerCase();
var title = document.title.toLowerCase();

if (
  title.includes("marketing with dave - all things digital marketing") ||
  title.includes("marketing with dave | all things digital marketing")
) {
  return "home-page";
}

if (title.includes("404")) {
  return "404";
}

if (url.includes("/search/?q=")) {
  return "site-search";
}

if (path.includes("case-study")) {
  return "case-study";
}

if (path.includes("book-summary")) {
  return "book-summary";
}

if (path.includes("the-a-to-z")) {
  return "the-a-to-z";
}

if (path.includes("the-evolution-of")) {
  return "the-evolution-of";
}

if (
  path.includes("calculator") ||
  path.includes("analyzer") ||
  path.includes("tools")
) {
  return "calculator";
}

return "not-classified";

}

How the script works

This script checks a small set of rules in order.

1. It looks for the home page title.

2. It checks for a 404 title.

3. It checks for a site search URL pattern.

4. It checks for specific URL structures like case-study, book-summary, the-a-to-z, and the-evolution-of.

5. It checks for calculator-related words in the URL.

6. If no match is found, it returns not-classified.

The order matters. More specific rules should always come before the fallback bucket.

Step 3: Add page_type to your GA4 page_view tag

Once the variable is created, open the GA4 page_view tag in Google Tag Manager.

If you have both a standard page_view tag and an internal version, update both so the data stays consistent.

In Event Parameters, add:

page_type = {{Page Type}}

This tells GTM to send the resolved page type value with each page_view event.

Step 4: Preview your changes in GTM

Before publishing, use Preview mode in GTM.

Visit several web pages on your website and verify that the variable returns the right values.

Examples:

A case study URL should return case-study.

A book summary URL should return book-summary.

A calculator or analyzer web page should return calculator.

The website home page should return home-page.

A regular article that does not match any defined rule should return not-classified.

Step 5: Publish the GTM container

Once Preview mode confirms the values are correct, publish the GTM container.

At that point, GTM is sending the page_type parameter to GA4, but GA4 still needs one final setup step before you can use it in reporting.

Step 6: Register the custom dimension in GA4

In GA4, go to Admin, then Custom definitions.

Create a new custom dimension with these settings:

Dimension name: Page Type

Scope: Event

Event parameter: page_type

Save the dimension.

From that point forward, GA4 will store and report on the page_type parameter.

Important note about historical data

GA4 custom dimensions are not retroactive.

This means page type data will only be available for traffic collected after the GTM changes are published and the custom dimension is created.

If you want a historical view, you would need to recreate it manually using existing URLs in a spreadsheet or another reporting layer.

How to analyze page type in GA4

Once the data starts flowing, one of the simplest and most useful reports is an Exploration showing sessions by page type.

A basic starting point is:

Rows: Page Type

Values: Sessions

This quickly shows what percentage of traffic is going to case studies, calculators, book summaries, site search, and everything else.

You can also combine page type with content topic to build a matrix like:

Rows: Content Topic

Columns: Page Type

Values: Sessions

That helps you understand both what the content is about and what format it takes.

Why this works well for content-driven websites

If your website includes multiple recurring content formats, page type tracking gives you a much better structural view of performance.

Instead of relying only on individual URLs, you can now see how the website performs by content model.

That is useful for editorial planning, content investment decisions, and identifying which kinds of web pages are becoming your strongest entry points.

Final takeaway

Page type tracking is one of the most useful content upgrades you can make in GA4. It adds a structural layer that makes your reporting far more meaningful than a simple list of URLs.

If your website already has recognizable URL patterns or stable page titles, Google Tag Manager can classify those web pages automatically and send the values into GA4 with very little maintenance required later.

And by keeping not-classified as an intentional fallback, you retain visibility into the portion of your website that still sits outside your current content taxonomy.

Track Page Types in Google Analytics 4 Using Google Tag Manager Read More »

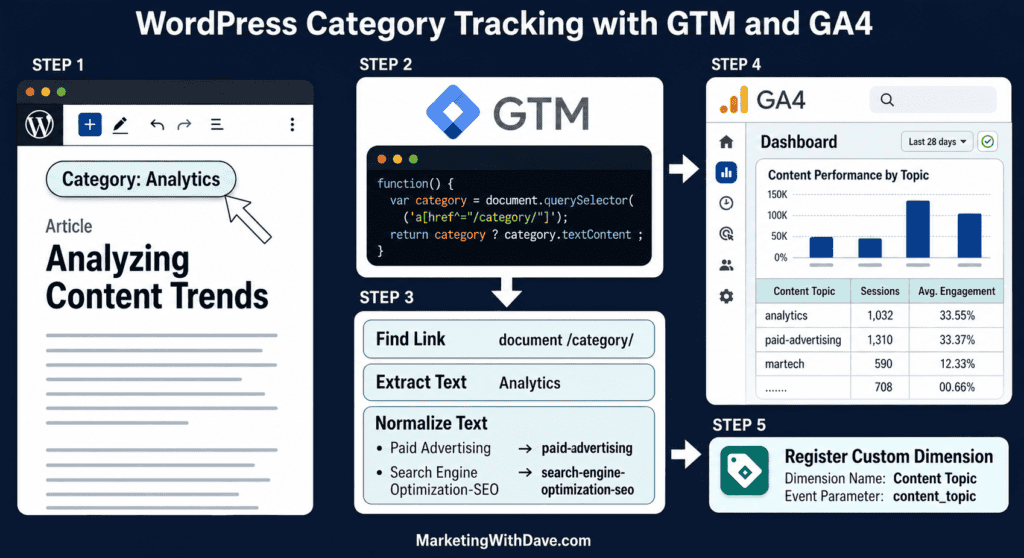
Analyzing content trends infographic showing WordPress category tracking with GTM and GA4 for marketing analytics and data-driven insights.

Setting Up WordPress Category Tracking in Google Tag Manager for GA4

Reading Time: 5 minutes

If you run a content-heavy WordPress website, there is a good chance you care about more than just web page views. You may also want to know which content topics actually drive sessions, engagement, and returning visitors.

That is where category tracking can help. In my case, I wanted Google Analytics 4 to capture the WordPress Category assigned to each article so I could analyze traffic by topic. This is especially useful when your content spans areas like analytics, martech, paid advertising, SEO, content marketing, and more.

The important detail is that WordPress Categories and WordPress Tags are different. If your website uses Categories as the main topic label on articles, your Google Tag Manager setup needs to pull from the Category link, not from a Tag link.

What this setup does

This approach reads the article’s visible WordPress Category from the web page, normalizes it into a GA4-friendly value, and sends it with your page_view event as a custom parameter.

For example:

Martech becomes martech

Paid Advertising becomes paid-advertising

Search Engine Optimization (SEO) becomes search-engine-optimization-seo

Artificial Intelligence (AI) becomes artificial-intelligence-ai

Why use Category tracking in GA4?

Once this is set up, you can analyze website performance by topic instead of just by URL.

This lets you answer questions like:

Which categories attract the most sessions?

Which categories drive the longest engagement time?

Which categories perform best for case studies, calculators, or other content types?

If you already have page type tracking in place, category tracking becomes even more powerful because you can compare format and topic together.

Before you start

This walkthrough presumes:

1. You are using WordPress.

2. Your article category appears visibly on the web page as a link.

3. The category link uses a URL structure containing /category/.

4. You already have Google Tag Manager installed.

5. Your GA4 page_view tag is firing through GTM.

Step 1: Confirm that your website uses Categories, not Tags

This part matters more than people realize.

If your website displays the topic label under the title and that label links to a URL like /category/martech/, then your GTM script should look for Categories.

If your setup uses WordPress Tags instead, the link would usually contain /tag/.

Step 2: Create a Custom JavaScript Variable in Google Tag Manager

In Google Tag Manager, go to Variables and create a new User-Defined Variable.

Choose Custom JavaScript as the variable type.

Name it something like:

Content Topic

Then use this script:

Some tutorials detect categories using URL patterns like /category/. That works on some WordPress websites, but many themes remove the category base from URLs. A more reliable approach is to target the category element directly in the HTML.

function() {
  var category = document.querySelector('.ast-terms-link a');
  if (!category || !category.textContent) return 'not-classified';

  return category.textContent
    .trim()
    .toLowerCase()
    .replace(/[()]/g, '')
    .replace(/\s+/g, '-')
    .replace(/[^a-z0-9-]/g, '')
    .replace(/-+/g, '-')
    .replace(/^-|-$/g, '');
}

Note: The selector .ast-terms-link a works for Astra theme. If you are using a different theme, inspect the category link on the web page and adjust the selector accordingly.

How the script works

This script does five things:

1. It looks for the first link on the web page that contains /category/.

2. It grabs the visible text of that link.

3. It trims extra spaces.

4. It converts the value to lowercase.

5. It removes special characters and replaces spaces with hyphens.

If no category is found, it returns not-classified.

This acts as a deliberate “other” bucket. Instead of mixing uncategorized traffic with GA4 labels like not set, you can clearly see what portion of your content taxonomy is missing or incomplete. Over time, the goal is not to eliminate not-classified, but to keep it at a healthy percentage.

Step 3: Add the parameter to your GA4 page_view tag

Next, open the GA4 page_view tag in Google Tag Manager.

If you have a standard page_view tag and a separate internal version, make sure you update both so the data stays consistent.

In the Event Parameters section, add a new parameter:

content_topic = {{Content Topic}}

That tells GTM to send the normalized category value with every page_view event.

Step 4: Preview the changes in GTM

Before publishing, use Preview mode in Google Tag Manager.

Open a few different article web pages and confirm that the Content Topic variable returns values you expect from your WordPress Categories.

For example, on a Martech article, the variable should return:

martech

On a Paid Advertising article, it should return:

paid-advertising

If you see a value that does not match one of your approved categories, your selector may be pulling from the wrong part of the web page.

Step 5: Publish the GTM container

Once preview mode looks good, publish the container.

At this point, GTM is sending the custom parameter to GA4, but Google Analytics 4 still needs one more step before you can use it in reports.

Step 6: Register the custom dimension in GA4

In GA4, go to Admin, then Custom definitions.

Create a new custom dimension with the following settings:

Dimension name: Content Topic

Scope: Event

Event parameter: content_topic

Save the custom dimension.

From that point forward, GA4 will store and report on the content_topic parameter.

Important note about historical data

GA4 custom dimensions are not retroactive.

That means this setup will only classify data collected after the custom dimension is created and GTM is published.

If you want historical analysis, you will need to build it manually using a spreadsheet or another reporting layer.

How to use the data in GA4

After the data starts flowing, the easiest place to analyze it is in Explorations.

A simple starting report is:

Rows: Content Topic

Columns: Page Type

Values: Sessions

This makes it easy to see which topics are driving traffic and how those topics map to different kinds of content.

Examples might include:

Case studies in martech

Book summaries in leadership

Articles in analytics

Calculators in website-related topics

Why this works well for WordPress websites

The biggest advantage of this setup is that it uses the taxonomy you already maintain in WordPress.

You are not inventing a separate analytics classification system. You are simply exposing your existing editorial structure to GA4.

That makes the reporting much easier to trust.

Can this work outside WordPress?

Yes, but the implementation details change.

The broader concept is the same: identify the topic label on the web page, extract it with GTM, normalize it, and send it to GA4 as a custom parameter.

What changes is the selector. Instead of looking for a WordPress Category link containing /category/, another platform might use a different class name, data attribute, or metadata element.

So the process is portable, but the selector is platform-specific.

Final takeaway

If your WordPress website uses Categories as the primary topic label for articles, GTM should pull from Categories and not Tags. That one detail can be the difference between clean, trustworthy GA4 topic reporting and a messy dataset you cannot rely on.

Once you set this up, GA4 becomes much more useful for understanding what your content is really doing by subject area, not just by individual URL.

Setting Up WordPress Category Tracking in Google Tag Manager for GA4 Read More »