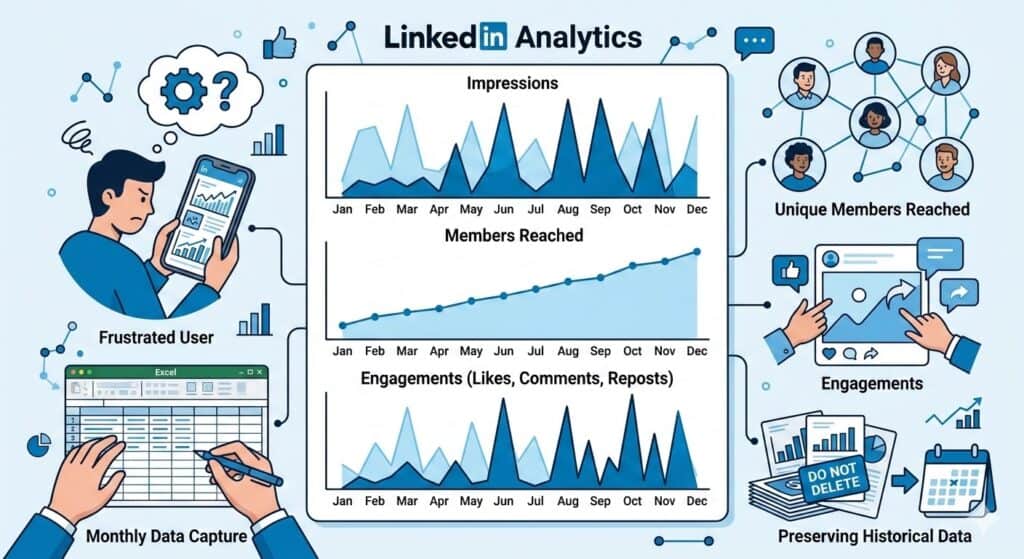
LinkedIn

linkedin analytics impressions members reached engagements

LinkedIn Analytics Explained: Impressions, Members Reached, and Engagement Trends

Reading Time: 4 minutes

Why You Rarely See LinkedIn Analytics Shared

I have never seen anyone publicly share their LinkedIn analytics.

I suspect there are two main reasons.

First, the data is surprisingly difficult to gather. LinkedIn only surfaces analytics through the mobile app. If you want monthly trends, you have to manually set the start and end date for each month and record the numbers yourself. For a platform likely worth well over $100 billion, the analytics experience feels incredibly primitive.

Second, LinkedIn is personal. The metrics can feel like a public scoreboard of how good someone is at networking, influence, or business. Most people would rather talk about success than show the full data behind it.

I have never pretended to be a great networker. I do not love the social side of business. What interests me more is the data and the insights we can learn from it.

The Three Metrics LinkedIn Actually Provides

So, I decided to track my LinkedIn analytics manually and share the results.

The platform essentially gives you three core metrics:

  1. impressions
  2. members reached
  3. engagements

That is not a lot to work with. Impressions in particular are often considered a vanity metric, but when that is one of the only signals available, you end up clinging to it anyway.

Limitations of LinkedIn Analytics

Before looking at the charts, there are two additional limitations worth mentioning about LinkedIn’s analytics.

First, LinkedIn only provides data for the most recent 12 months. If you want to track longer term trends, you need to capture the numbers yourself. Once the window moves forward, older data simply disappears. Even if you are not planning to analyze it immediately, it is worth recording the numbers each month so you have the history available later.

Second, LinkedIn’s built in analytics leave out several metrics that are useful for understanding growth. Because of that, I have been experimenting with tracking additional signals outside the platform.

For example, I wrote about a method for tracking monthly LinkedIn follower growth using Excel formulas. Follower growth is one of the few ways to measure whether your audience is actually expanding over time.

Another metric that may relate to these trends is LinkedIn’s Social Selling Index (SSI), which attempts to measure how effectively you build relationships, share insights, and engage with your network.

I suspect there may be interesting relationships between SSI scores, follower growth, impressions, and engagement trends, although LinkedIn does not provide an easy way to analyze them together.

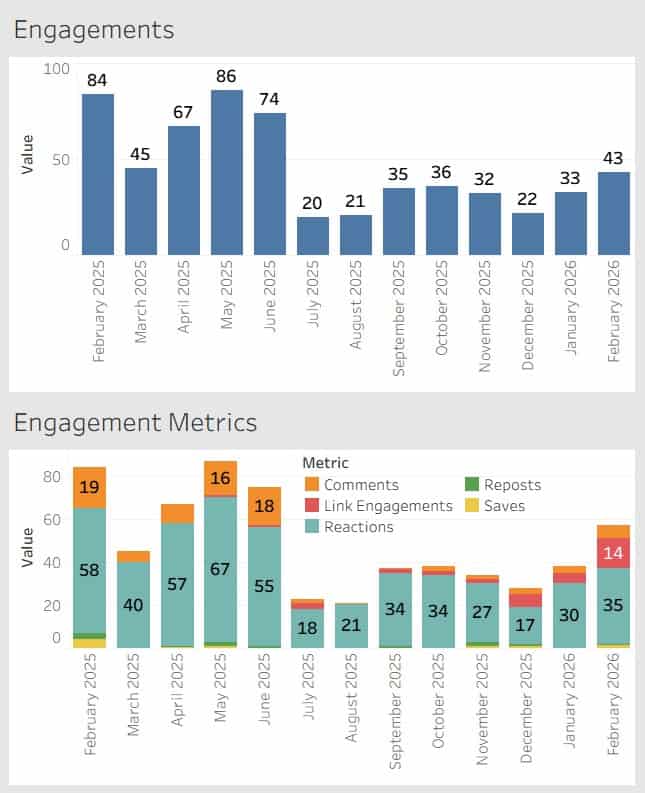
With that context in mind, here are the metrics LinkedIn currently provides.
Observations From the Data

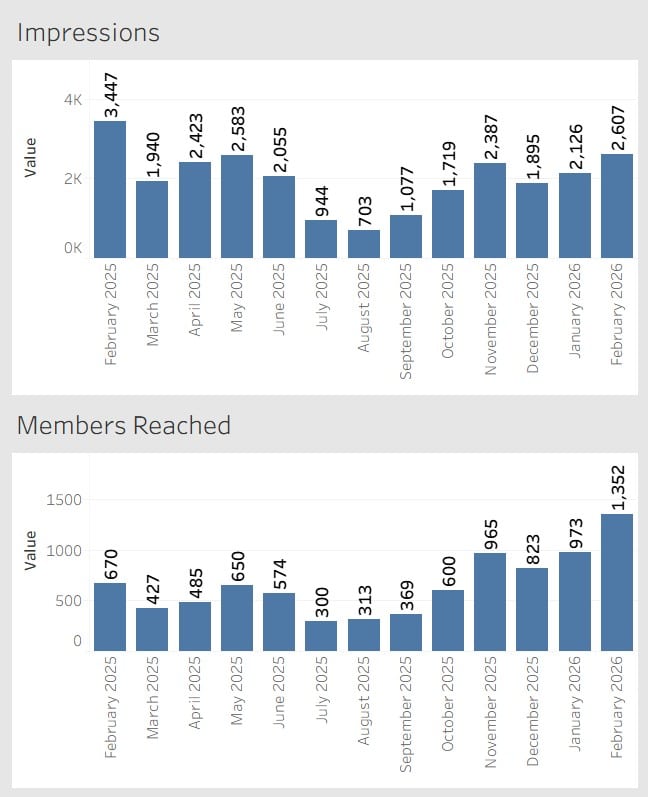
Looking at these charts, a few patterns stand out.

First, impressions are volatile. The numbers fluctuate significantly from month to month without an obvious pattern. Some months see more than triple the impressions of others.

Second, members reached shows a much steadier upward trend. While there are some fluctuations, the overall direction appears to be gradual growth over time.

Third, engagements tend to follow impressions more closely than members reached. When impressions spike, engagement usually rises with it.

One other note for transparency. A portion of the repost activity counted in these numbers comes from my own reposts.

What This Data Does and Does Not Tell Us

With only three primary metrics available, it is difficult to draw strong conclusions.

Impressions tell us how many times content appeared in feeds, but they do not tell us whether people actually consumed the content.

Members reached provides a slightly better signal because it reflects the number of unique individuals exposed to the content.

Engagements provide the most meaningful signal of the three, but even here the data is limited. LinkedIn groups together different types of engagement without providing deeper context around why certain posts perform better than others.

In other words, the data hints at patterns but does not fully explain them.

What This Data Actually Helps You See

Trending these metrics over time does reveal some patterns, but it also highlights how limited LinkedIn analytics really are.

You can see visibility trends through impressions.
You can see how many unique people are exposed to your content through members reached.
You can see whether people interact through engagements.

What you cannot easily see is why.

LinkedIn does not tell you which topics consistently perform better, how your audience is evolving, or how your content strategy influences long-term growth. Even something as basic as exporting and trending this data requires manual work.

So while these metrics provide some direction, they rarely provide clear answers.

Why Trending the Data Still Matters

Despite those limitations, there is still value in tracking these numbers.

Most LinkedIn users never see their analytics over time. The platform shows short windows of performance, but trends only become visible when the data is captured month after month.

Over time you begin to notice patterns such as seasonal changes in activity, how impressions fluctuate, and whether your network is gradually expanding.

Even if the insights are imperfect, trending the data provides far more context than looking at a single post in isolation.

A Simple Recommendation

If you take one action from this article, it should be this.

Once a month, capture your LinkedIn metrics.

Record impressions, members reached, engagements, and follower growth in a simple spreadsheet. LinkedIn only provides a rolling twelve-month window, so historical data disappears unless you save it yourself.

You may not analyze it right away, but future you will be glad the data exists.

LinkedIn Analytics Explained: Impressions, Members Reached, and Engagement Trends Read More »
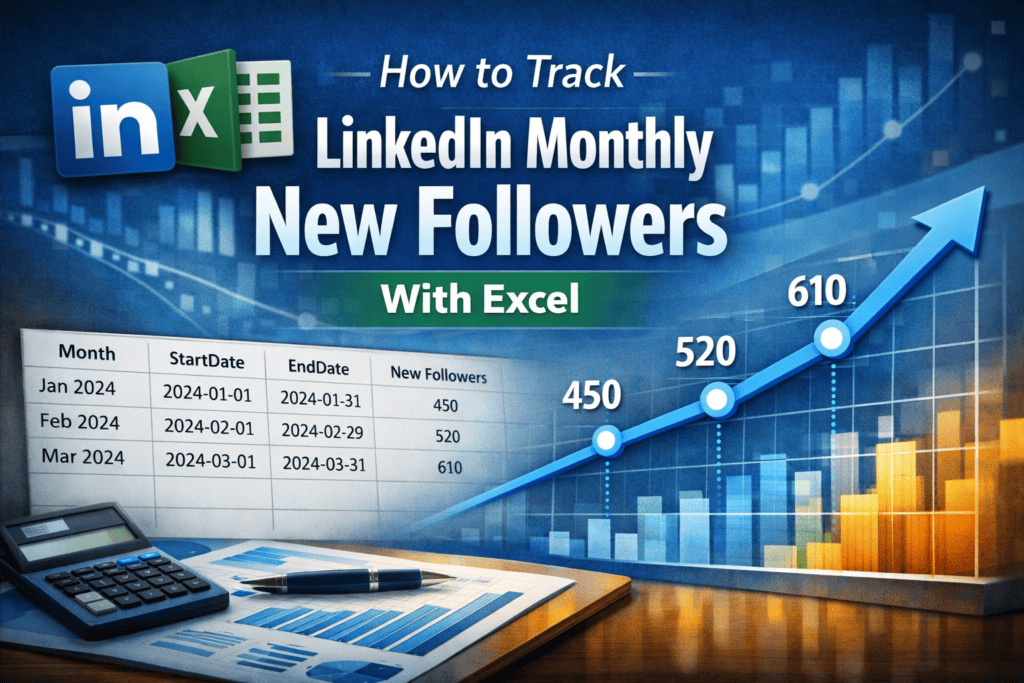
how to track linkedin monthly new followers

How to Track LinkedIn Monthly New Followers With Excel

Reading Time: 5 minutes

Quick summary: LinkedIn does not provide an export for personal follower analytics, but the Creator Audience analytics view supports custom date ranges. By generating monthly links with Excel formulas, you can capture cumulative new followers by month and build a trend dataset for dashboards and reporting.

LinkedIn’s Creator Audience view can show cumulative follower growth over custom date ranges, and it often provides a deeper lookback window than other profile metrics (which frequently only go back about a year). This quick Excel hack helps you generate a clickable URL for every month so you can capture monthly new followers in minutes and build a trend dataset for Tableau, Excel charts, or reporting.

In this tutorial, you will:

1. Create a simple Excel table with month start and end dates

2. Automatically generate correct month boundaries, including leap years

3. Build a monthly LinkedIn Creator Analytics link for each month

4. Capture monthly new follower totals from the cumulative chart

Important note about this method

This is not an officially documented LinkedIn export feature. It is a repeatable workflow based on how LinkedIn’s Creator Audience analytics URL parameters behave in the browser. LinkedIn can change these parameters or the analytics experience at any time. Use this as a practical workaround for building your own dataset.

What you need

1. A LinkedIn account with access to Creator Analytics

2. A desktop browser (recommended)

3. Excel or Google Sheets (Excel formulas below)

4. A place to record monthly results (a spreadsheet is perfect)

Step 1: Confirm you can access the Creator Audience analytics view

Open LinkedIn in a desktop browser while logged in, then paste this into your address bar:

https://www.linkedin.com/analytics/creator/audience

If you can see an audience analytics view, you are in the right place. If you do not have access, you may need to enable Creator Mode or you may not have this feature available in your account.

Step 2: Understand the URL pattern we will generate in Excel

LinkedIn’s Creator Audience analytics supports custom date ranges via URL parameters. The key parameters used in this workflow are:

startDate=YYYY-MM-DD

endDate=YYYY-MM-DD

timeRange=custom

lineChartType=cumulative

We will use Excel to generate a monthly link for each month so you can open the link, confirm the date range, and capture the cumulative new follower value for that month.

Step 3: Set up your Excel table

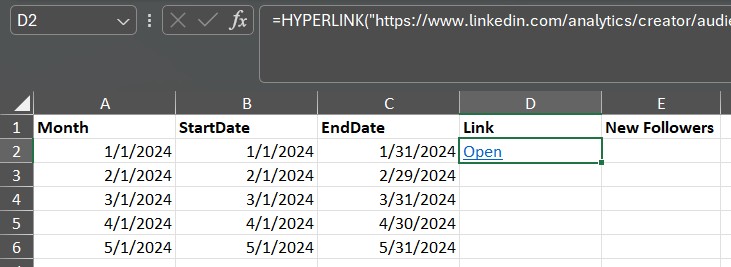
Create a new Excel sheet with these column headers:

A: Month
B: StartDate
C: EndDate
D: Link
E: New Followers (entered manually)

In cell B2, enter the first month start date you want to track. Example:

2024-01-01

Make sure columns B and C are formatted as dates.

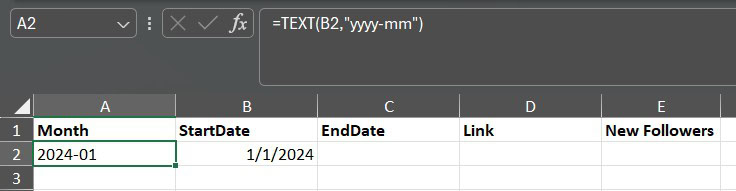
In cell A2, generate your Month label from the StartDate. This helps with sorting and makes the table easier to scan while you build it.

Option 1 (best for Tableau sorting):

=TEXT(B2,”yyyy-mm”)

Option 2 (more readable):

=TEXT(B2,”mmm yyyy”)

You can copy the Month formula down after you fill your StartDate column in the next step.

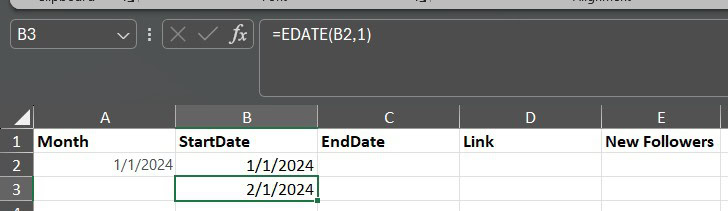
Step 4: Generate the next month StartDate automatically

In cell B3, enter this formula:

=EDATE(B2,1)

Copy B3 down to generate future months. This advances by exactly one calendar month and handles year changes automatically.

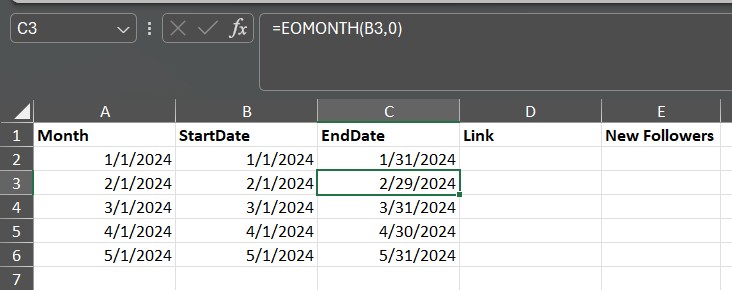
Step 5: Generate the month EndDate automatically

In cell C2, enter this formula:

=EOMONTH(B2,0)

Copy C2 down for all rows. This automatically returns the last day of each month, including February 29 during leap years.

Step 6: Create a clickable monthly analytics link

In cell D2, use this formula to generate a clean, clickable link labeled Open:

=HYPERLINK(“https://www.linkedin.com/analytics/creator/audience/?startDate=”&TEXT(B2,”yyyy-mm-dd”)&”&endDate=”&TEXT(C2,”yyyy-mm-dd”)&”&timeRange=custom&lineChartType=cumulative”,”Open”)

Copy D2 down for all rows.

Copy A2 down for all rows.

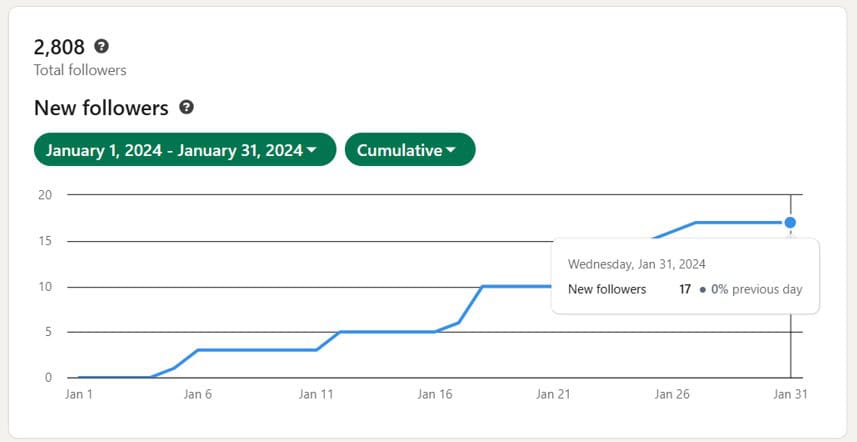
Step 7: Capture monthly new follower totals

For each month (each row):

  1. Click the Open link in column D
  2. Confirm the date range matches the month you are tracking
  3. Confirm the chart is in cumulative mode
  4. Hover the last point on the chart and record the cumulative new follower value
  5. Enter that value in column E (New Followers)

Recommended tracking protocol

To keep your dataset consistent, run this process on the first day of each month for the prior month. Example: capture January’s value on February 1. If you do it mid-month, your interpretation of month-to-month changes becomes less clean.

How to use the dataset

Once you have monthly values, you can:

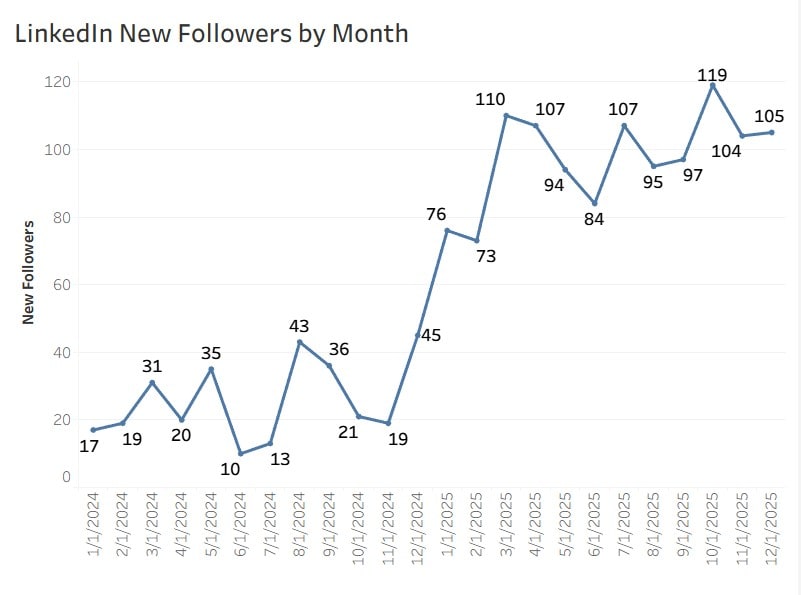
1. Create a line chart of New Followers by Month

2. Add a rolling 3-month average to smooth spikes

3. Compare follower growth to your posting frequency (if you track it)

4. Use the dataset in Tableau for a dashboard and blog content

Common troubleshooting

1. Excel shows numbers like 45322 instead of a date

This usually means the cell is formatted as a number. Change the column format to a date (Home menu, Number format, choose Short Date or Date).

2. The link opens but the date range does not look right

Make sure your StartDate and EndDate cells are true dates, and confirm the TEXT format in the formula is exactly yyyy-mm-dd.

3. You cannot access the Creator Audience analytics view

Your account may not have Creator Analytics enabled or available. Try enabling Creator Mode and then revisit the URL.

4. You do not see cumulative mode

LinkedIn occasionally changes analytics UI elements. If the view still shows follower growth but the cumulative toggle looks different, capture the monthly total using the last visible value in the chart.

Limitations to understand up front

LinkedIn personal profile analytics are not designed for exporting and trending. This method works best for follower growth because the Creator Audience view can provide a deeper history window than other profile metrics. Other personal profile metrics may not support consistent month-by-month extraction and may only be visible for shorter windows.

If you build a dashboard from this, document your capture schedule and save occasional screenshots so you have a clear audit trail for how the dataset was created.

Frequently asked questions

Does LinkedIn provide an official export for follower analytics?

No. Personal profile analytics do not currently support any export options. This method uses the Creator Audience analytics view with custom date ranges.

Does this work for company web pages?

Company web pages have built-in analytics exports. This method is most useful for personal profiles where export is not available.

How to Track LinkedIn Monthly New Followers With Excel Read More »

linkedin impressions

What Happened When I Cut My LinkedIn Post Frequency in Half

Reading Time: 2 minutes

Earlier this year, I published a post about what I learned from posting every business day on LinkedIn for a full month. Since then, I’ve kept experimenting and paying close attention to what’s working and what’s sustainable.

From January 1 to May 14, I posted on LinkedIn every business day minus holidays. But starting May 14, I made a strategic shift to publish only twice a week—on Tuesdays and Thursdays.

I wasn’t burned out or running out of ideas. But I received some thoughtful feedback from a former colleague to scale back so I could focus more on my MBA and job search. I took that advice seriously despite cutting back on something I loved.

So, did posting less often hurt my reach or engagement?

Impressions: Consistent Results, Slightly Fewer Spikes

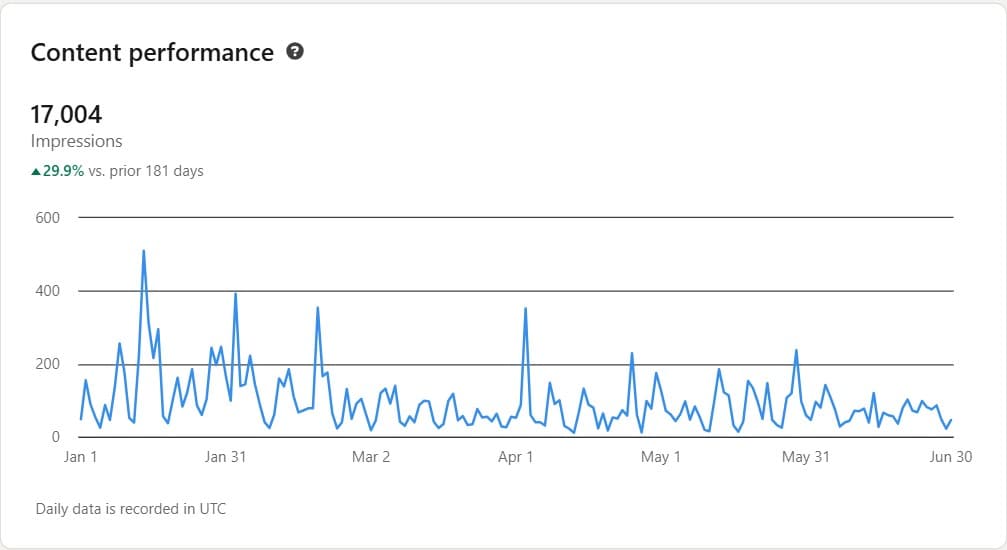
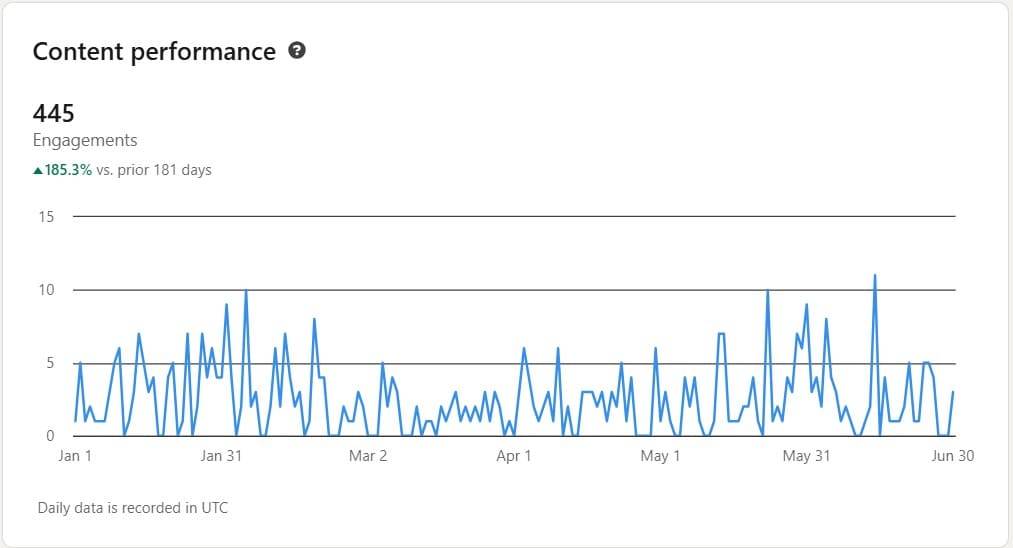
From January through June, I earned over 17,000 impressions on my LinkedIn posts, up nearly 30% compared to the previous 181-day period. Even after scaling back, my overall reach didn’t drop significantly. The volume stayed consistent. What did change is the number of dramatic spikes. Earlier in the year, I saw several big jumps in visibility. Since May 14, the trend has been flatter, which could be due to reduced post volume, or simply the nature of the topics I’ve been covering lately.

But the key takeaway? Less frequent posting hasn’t hurt performance in any meaningful way.

Engagement: Holding Steady, Even Improving

Even more interesting is the engagement. My posts generated 445 engagements—a jump of 185% from the previous period. That’s comments, reactions, and shares, which reflect how the audience is actually interacting with my content.

Since May 14, I’ve seen strong bursts of engagement, even with just two posts per week. In some cases, the engagement looks higher than what I saw while posting daily. This suggests a few things:

  • Quality over quantity is working. Posting less hasn’t dulled my impact. It may have sharpened it.
  • Intentional content resonates more. With fewer posts, each one stands out more and gives people space to respond.
  • Consistency still matters. Even at twice a week, maintaining a regular rhythm helps keep my audience connected.

I didn’t disappear. I just got more focused. And the data shows that approach is paying off.

Final Thoughts

This small experiment has reminded me that posting daily isn’t the only way to grow. For me, twice a week feels sustainable and effective, and it gives me room to create better content while pursuing other goals.

I’ll keep tracking, updating these charts, and adjusting along the way. If you’re wondering whether to scale back your own content schedule, know this: staying visible doesn’t mean staying overwhelmed. Be consistent, stay intentional, and measure what matters.

Have you adjusted your posting cadence before? I’d love to hear what changed for you.

What Happened When I Cut My LinkedIn Post Frequency in Half Read More »

linkedin your social selling index ssi 1

What’s Your LinkedIn Social Selling Index (SSI)

Reading Time: 2 minutes

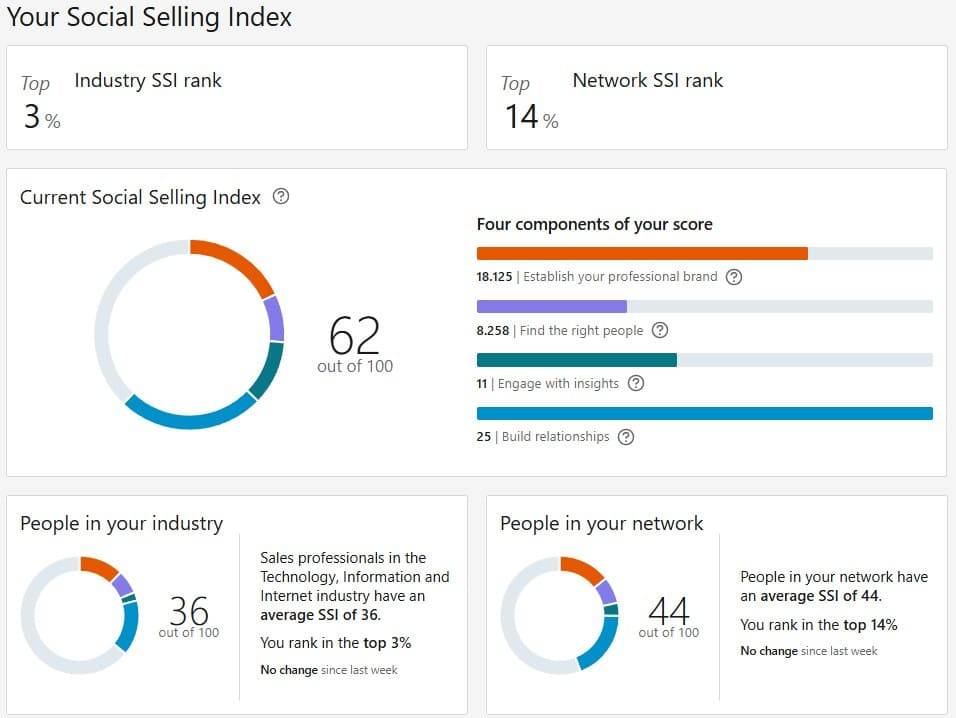
Did you know LinkedIn provides a free Social Selling Index (SSI) to help you measure your effectiveness on the platform? Updated daily, your SSI score evaluates how well you’re leveraging LinkedIn across four key areas:

  • Establishing your professional brand – Are you optimizing your profile and sharing valuable content?
  • Finding the right people – Are you strategically connecting with relevant professionals?
  • Engaging with insights – Are you interacting with content in meaningful ways?
  • Building relationships – Are you nurturing connections and growing your network?

Your SSI score ranges from 0 to 100, and a score of 70 or higher is considered strong. In fact, LinkedIn reports that top social sellers tend to score above 75, significantly outperforming those with lower scores in terms of sales success and engagement.

Additionally, your SSI dashboard allows you to compare your score to others in your industry and network, providing useful benchmarks. Here’s a look at my own SSI score:

To check your own SSI, visit: LinkedIn SSI Dashboard

How to Improve Your LinkedIn SSI Score

If your score isn’t where you’d like it to be, here are some actionable ways to boost it:

  • Optimize Your Profile – Ensure your headline, summary, and experience sections highlight your expertise. Use a professional photo and a compelling background banner.
  • Share Valuable Content – Post industry insights, personal takeaways, and helpful resources regularly.
  • Engage with Others’ Content – Comment thoughtfully, react, and share posts to stay active in discussions.
  • Connect Strategically – Send personalized connection requests and build a meaningful network rather than just growing numbers.
  • Use LinkedIn’s Search Tools – Leverage advanced search to find and connect with the right professionals.

A strong SSI isn’t just about a number—it’s a reflection of how well you use LinkedIn to build authority, engage meaningfully, and strengthen professional relationships.

What’s your current SSI score? Share your insights in the comments!

What’s Your LinkedIn Social Selling Index (SSI) Read More »

What I Learned Posting on LinkedIn Every Day for a Month

Reading Time: 3 minutes

I set a simple goal to post on LinkedIn every business day in January—no expectations, just trying to share valuable digital marketing insights with every post. Now that January’s wrapped up, here’s how it went:

Key Metrics:

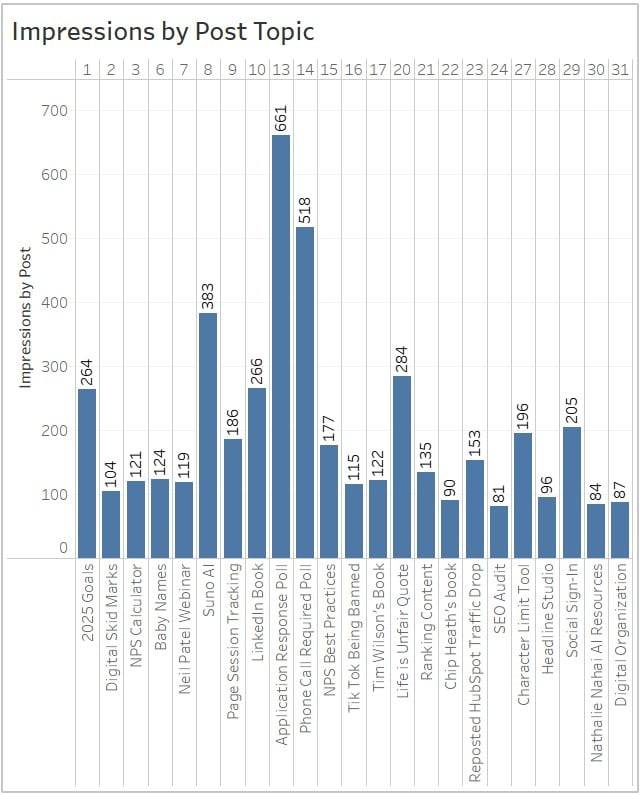
  • 4,716 impressions
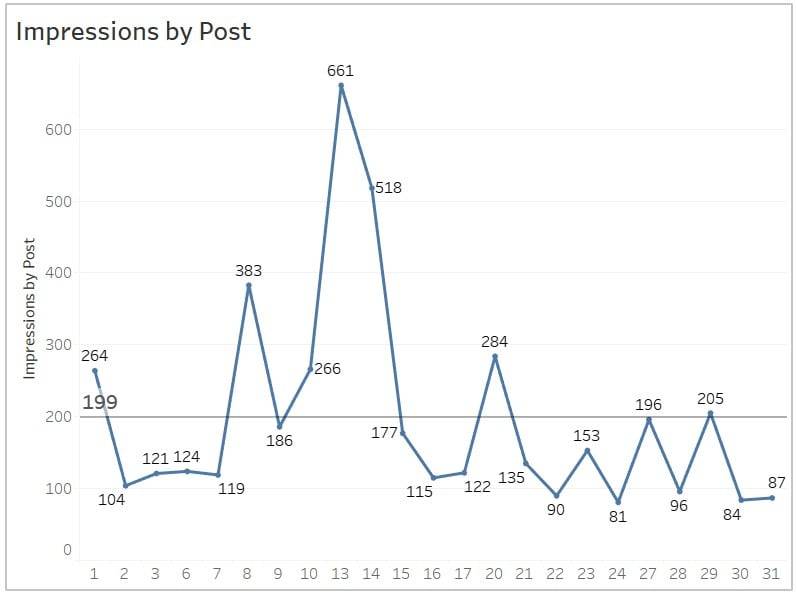
  • 121 average impressions per post
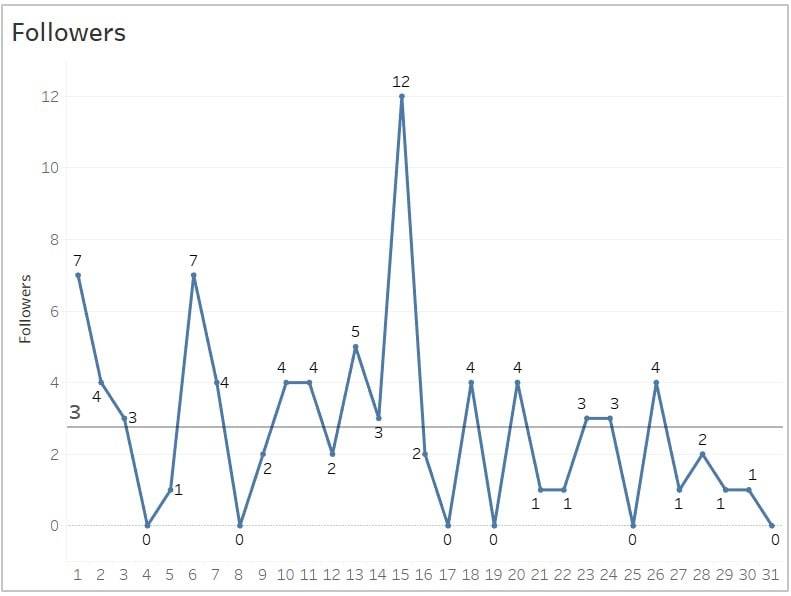
  • 85 new followers
  • 73 reactions
  • 25 comments
  • 14 reposts
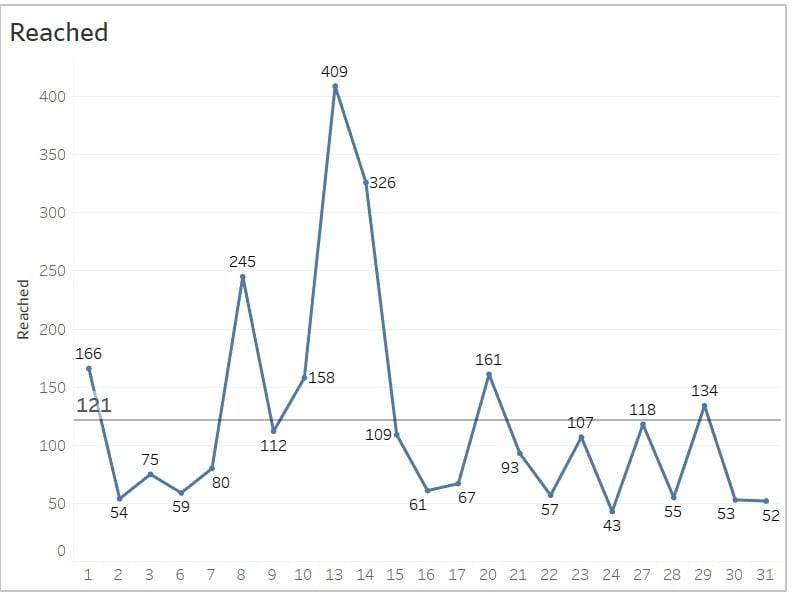
  • Reach per post ranged from 52 to 409

Insight #1: Topics and Hashtags Matter Most

While I didn’t expect hockey stick growth for any metric, I did expect impressions to gradually increase over time, but the data told a different story. Impressions fluctuated based on the popularity of individual posts rather than building momentum. The hashtags used and post relevance seemed to be the real game-changers.

Insight #2: Don’t Forget the Weekends

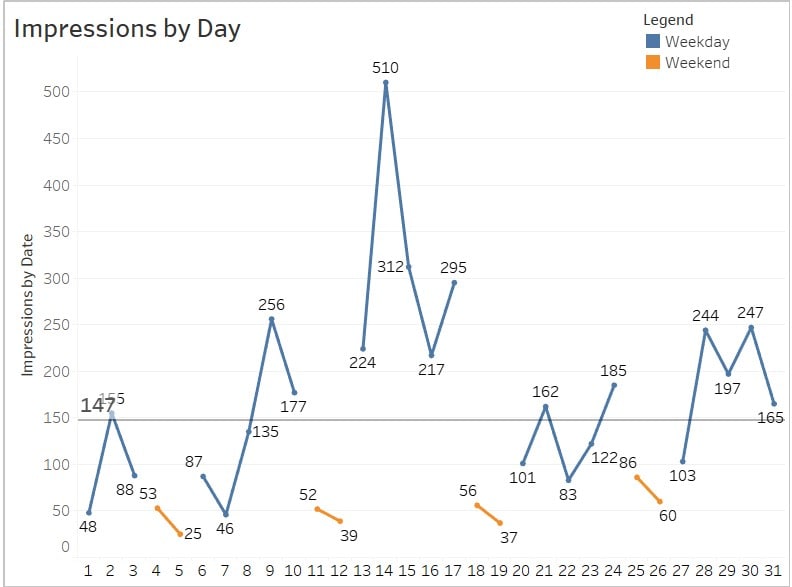
I expected low weekend traffic since I only posted Monday through Friday, but impressions remained consistent and even beating out some of my weaker posts. This shows LinkedIn content has a longer shelf life, and many professionals are active even on weekends, catching up or browsing casually. Posting on the weekend may be a worthwhile future test.

Insight #3: The Most Relevant Content Wins

LinkedIn is a website for professionals so it’s not a stretch to think content focused on professional growth, networking, and the job search process would perform best. My posts discussing if job applications should receive email responses and if phone calls should be required at certain interview stages significantly outperformed all others, proving that topics directly tied to career experiences resonate most with the audience.

Insight #4: Follower Growth Matches Impression Trend

Follower gains fluctuated daily, with noticeable spikes aligning with highly engaging content. The largest surge occurred on the 15th, suggesting that standout posts can significantly boost growth. Maintaining a regular posting schedule would likely help sustain a steady follower increases over time.

Insight #5: Engaging Content Expands Reach

Reach showed similar fluctuations to follower growth, with peaks corresponding to days when content resonated strongly with the audience. This pattern highlights that while consistency is key, creating posts that spark interest and interaction can significantly amplify visibility beyond your immediate network.

What I Learned Posting on LinkedIn Every Day for a Month Read More »

linkedin 2024 posts

LinkedIn 2024 Posts

LinkedIn 2024 Posts Read More »