Marketing surveys have played a pivotal role in shaping the way businesses understand and engage with their customers.
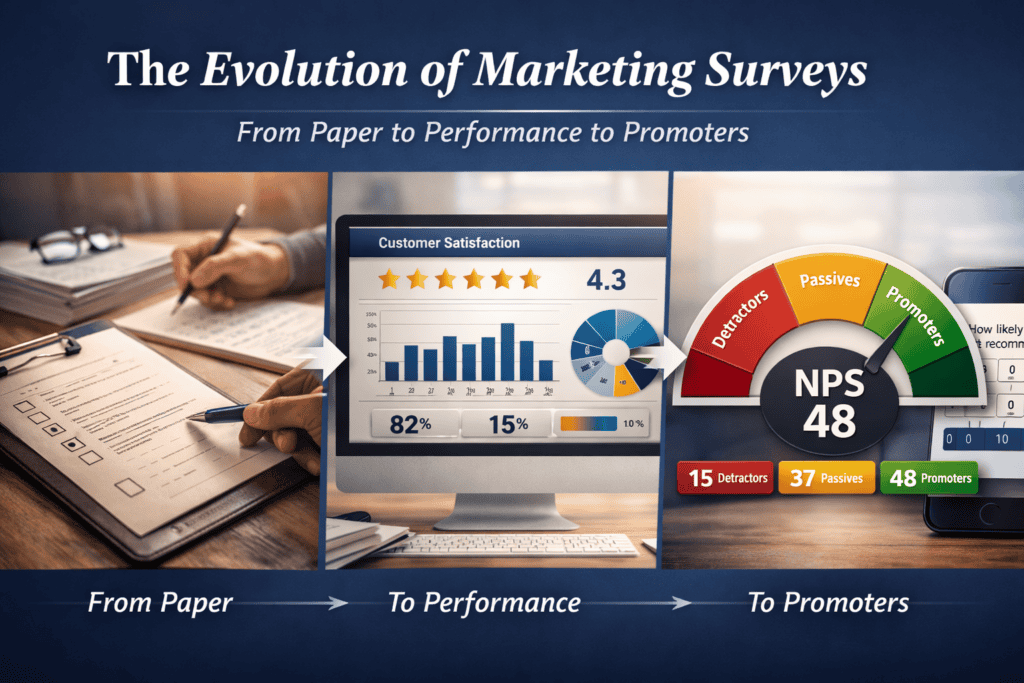
From the early days of simple feedback forms to the sophisticated tools we use today, surveys like Net Promoter Score (NPS), Voice of Customer (VoC), and Customer Satisfaction (CSAT) have evolved significantly. This timeline takes you through the history of these essential survey methods, exploring their development and impact on modern marketing strategies.
1750 BC
Circa – A Babylonian merchant writes the first known customer complaint on a clay tablet.
1912
– Charles Parlin conducts the first large-scale consumer surveys in the US, launching modern market research.
1932
– Rensis Likert introduces the 5-point Likert scale to measure attitudes in surveys.
1936
– George Gallup demonstrates the power of scientific sampling in surveys by correctly predicting the US presidential election.
1968
– J.D. Power and Associates begins surveying auto customers, launching industry benchmarks for satisfaction.
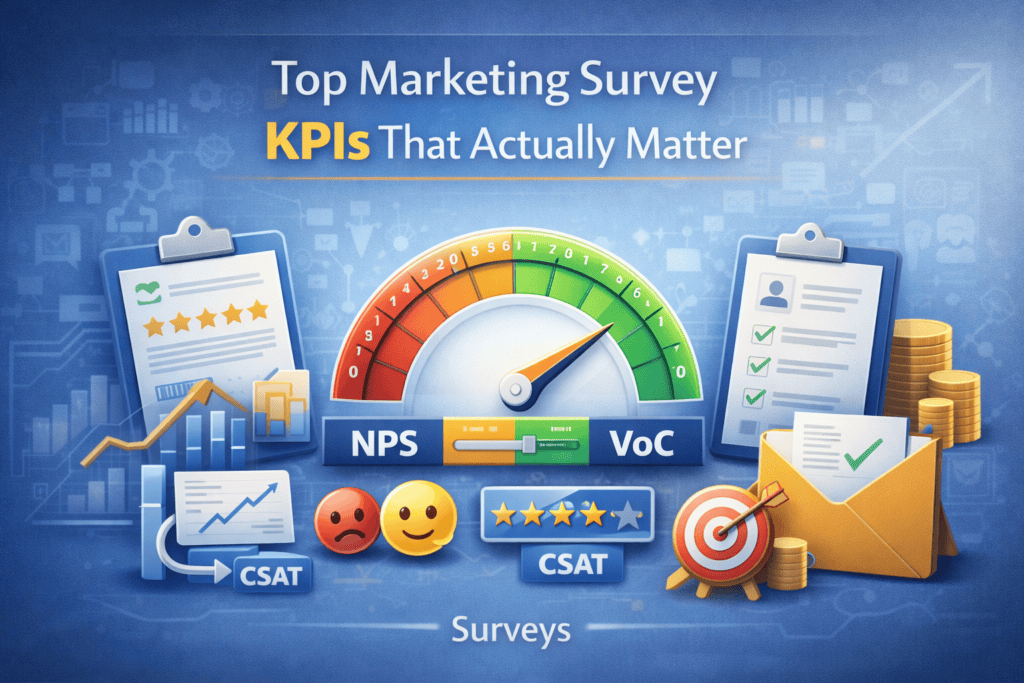
Marketers serious about understanding their customers can’t afford to treat surveys as a checkbox. Whether it’s Net Promoter Score (NPS), Customer Satisfaction (CSAT), or broader Voice of Customer (VoC) programs, survey data should inform strategy — not just sit in a dashboard.
Below are the essential KPIs and stats that reveal how real companies are collecting, using, and acting on customer feedback today. These aren’t vanity numbers — they’re backed by research and chosen for their direct marketing relevance.
“39% of companies don’t regularly ask customers for feedback about their interactions.”
That’s nearly 4 in 10 businesses missing a crucial opportunity to listen and improve — a competitive disadvantage in today’s market.
“NPS fell significantly for the majority of industries for both countries. NPS improved for only one industry in each country: airlines in the US and luxury auto manufacturing in Canada.”
Most industries saw flat or falling NPS, indicating it’s harder to gain loyal customers today without focused CX efforts.
“Organizations that demonstrate how customer satisfaction is associated with growth, margin and profitability are more likely to report customer experience success and are 29% more likely to secure more CX budgets.”
Measuring and communicating NPS/CSAT impact on the bottom line helps justify resources for VoC initiatives.
“NPS scores provide a snapshot of your overall customer experience; if customers are more likely to recommend your business, that naturally points to a high level of customer satisfaction and a positive customer journey.”
Marketers should compare their score to relevant industry norms.
“Promoters are significantly more likely than passives or detractors to exhibit all three key loyalty behaviors: purchasing more, trusting the company to take care of their needs, and forgiving the company if it makes a mistake.”
Converting a detractor into a promoter has far greater revenue impact in some industries.
Customer satisfaction surveys are only as valuable as the insights you extract from them. While raw response data offers a starting point, visualizing that data—especially when segmented by customer type—can reveal patterns, pain points, and opportunities that might otherwise go unnoticed. In this post, I’ll walk through a series of sample survey questions using fictitious data to demonstrate how visual analysis helps uncover deeper insights.
However, one effective and visually engaging way to represent this type of feedback is by using a word cloud generator. Word clouds highlight frequently used words or phrases by scaling them in size based on how often they appear—offering a quick, compelling snapshot of recurring themes.
Question 1: Customer Type
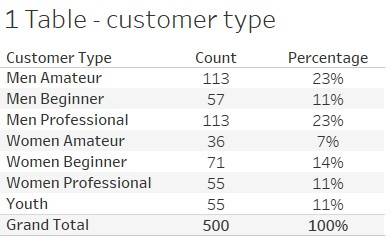
The first question asks, “Please select your customer type from the list below.” While this fictitious data may not be particularly insightful on its own, its true value emerges when combined with responses to other survey questions. The table below shows the count and percentage breakdown for each customer type.
Question 2: User vs. Manager/Support Role
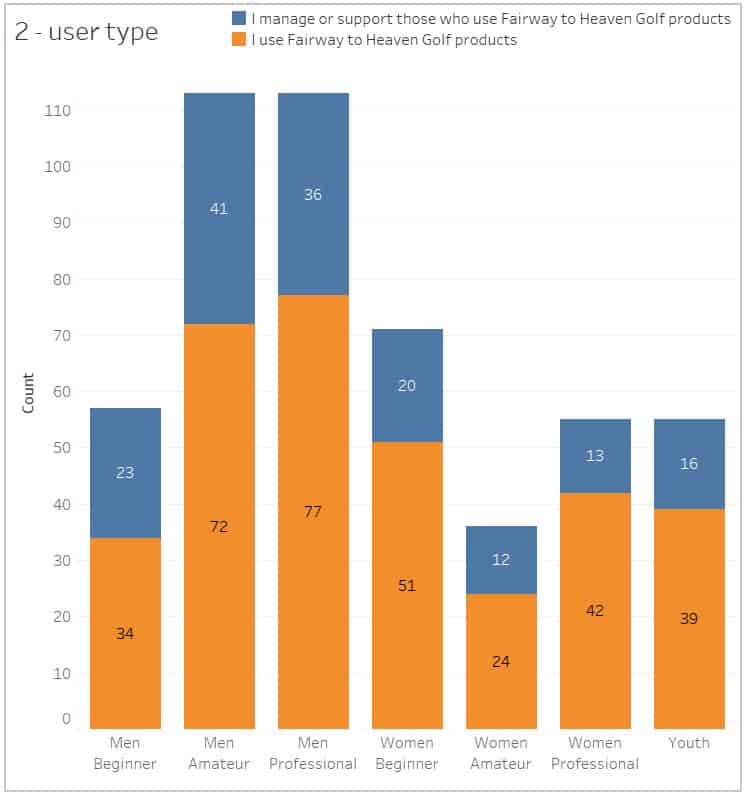
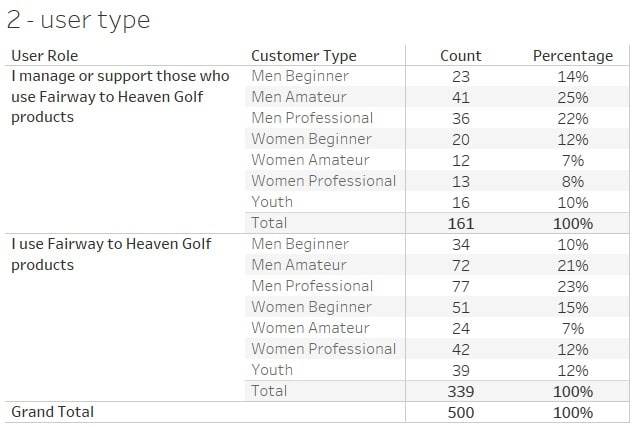
The second question asks, “Which of the following best describes you?” with response options such as “I use X products” or “I manage or support those who use X products.” The graph below presents the results for this question, segmented by the customer types from the previous question. A stacked bar chart (shown below the table) is likely the preferred format, as it clearly illustrates how each customer type breaks down across the two roles. Notably, both Men Amateur and Men Professional include a significant portion of respondents who don’t directly use golf equipment but represent a valuable, distinct segment—one that warrants personalized targeting due to their influence and unique needs.
Question 3: Likelihood to Continue
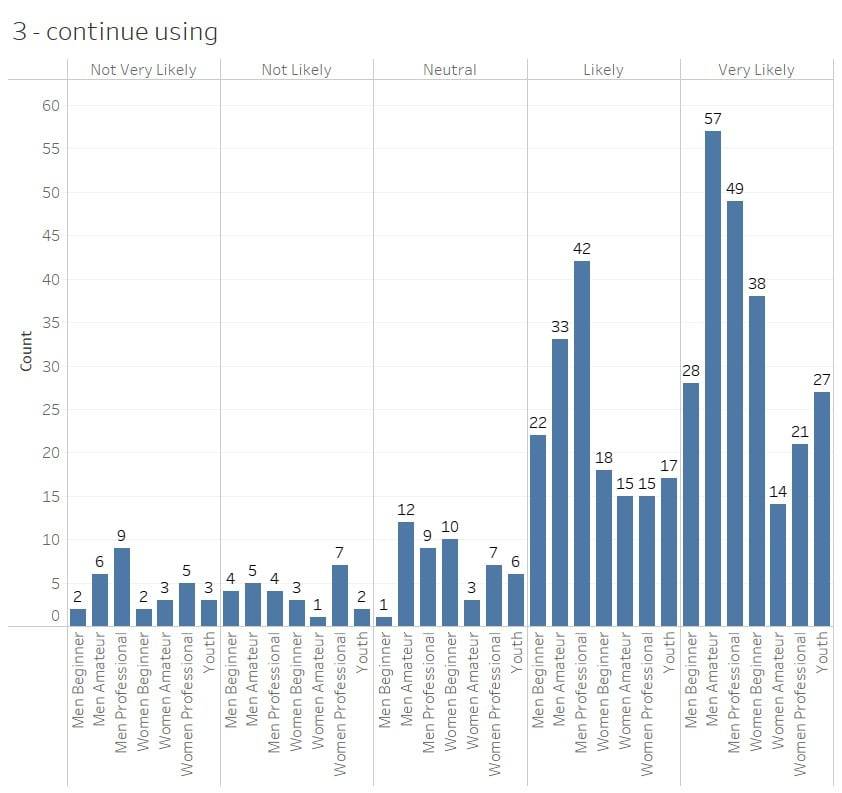
The third question asks, “How likely are you to continue using our products and services?” In our example data, the Men Amateur segment stands out—they are both the largest group selecting Very Likely to continue and the largest group choosing Not Very Likely, Not Likely, and Neutral. While this is only sample data, it illustrates how this type of chart can surface important patterns and contradictions within segments—offering deeper insights than overall averages alone.
Question 4: Product Satisfaction
The fourth question asks, “Overall, how satisfied are you with the following [company] products?” Responses were captured on a five-point satisfaction scale. To support analysis, we translated these into a numeric scale, assigning 5 to Very Satisfied and 1 to Not Very Satisfied. This approach makes it easy to identify patterns—such as the Men Professional segment showing the lowest satisfaction scores for drivers. This could indicate the equipment isn’t meeting their performance expectations, perhaps lacking the stiffness or control they require. Either way, it’s a signal worth investigating further.
Question 5: Service Satisfaction
The fifth question, similar to the previous one, shifts the focus from products to services and asks, “Overall, how satisfied are you with the following [company] services?” As before, responses were converted to a numeric scale ranging from 1 (Not Very Satisfied) to 5 (Very Satisfied). In this example, the Women Professional segment reports the lowest satisfaction with speed of play. One possible explanation is that this group, likely teeing off from the forward (red) tees, may still have to wait for the group ahead to clear out of their driving range—leading to delays that impact their overall experience. This insight suggests an opportunity to explore pace-of-play improvements or better course flow accommodations for this segment.
Question 6: Ease of Doing Business
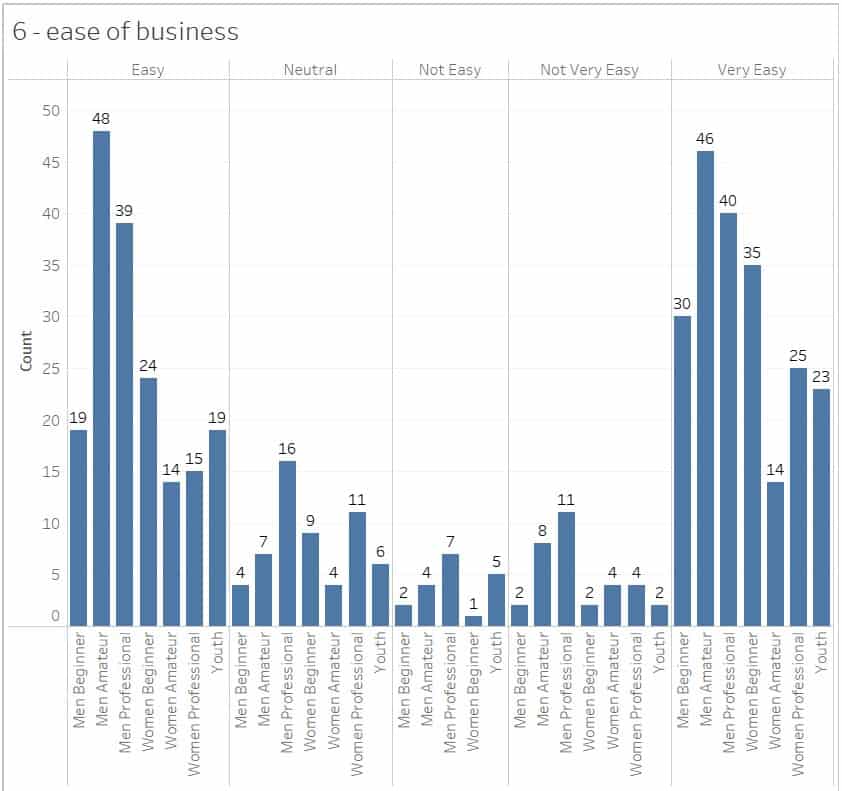
The sixth and final question asks, “Overall, how easy is it to do business with [company]?” The Men Professional segment stands out, with the highest number of responses in the Not Very Easy, Not Easy, and Neutral categories. This suggests that, for this group, the customer experience may be falling short.
Conclusion: Turning Visual Insights Into Action
Visualizing your customer satisfaction survey data is more than a reporting exercise—it’s a critical step toward understanding your audience, segmenting with intent, and prioritizing actions that improve loyalty and retention. From identifying product dissatisfaction among advanced users to uncovering hidden friction points in the customer journey, these visualizations offer strategic leverage.
As you review your own survey data, segment by customer type, look for outliers, and focus on translating findings into experiments. What can you fix, enhance, or personalize? That’s where the real value of survey data lies—not in collecting it, but in acting on it.
In a previous blog post—Best Questions to Include in Your Customer Satisfaction Survey—I outlined the most effective questions to ask when measuring customer satisfaction. One of the most common and impactful questions is the Net Promoter Score (NPS) question:
“How likely are you to recommend [Company/Product/Service] to a friend or colleague?”
Since many businesses rely on NPS to gauge customer loyalty, it’s essential to move beyond just collecting responses and dive into analyzing the data for actionable insights. In this post, I’ll share 10 key insights you can uncover when you analyze your NPS survey data—and provide examples of how to interpret the results.
To illustrate these insights, I’ll use a fictitious company called Fairway to Heaven Golf, which sells drivers, irons, and putters to men, women, and youth. Our sample dataset includes 500 customer responses, offering a rich foundation for analysis.
1. Filter by Customer Type
Segmenting your NPS survey results by customer type is one of the most powerful ways to uncover actionable insights. Each customer type represents a distinct group with unique needs—often aligning with specific products or services you offer.
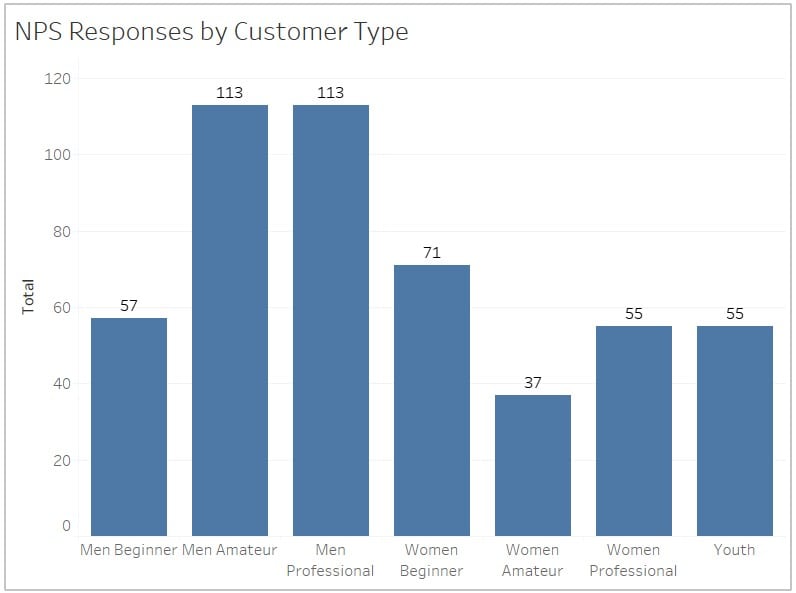
In our Fairway to Heaven Golf example, we’ve identified seven customer types, as shown in the graph below. While the number of survey responses for each type may not mirror your overall customer distribution, this breakdown raises immediate questions:
Why was one customer segment less responsive?
Do we need more responses from certain segments to ensure a valid sample?
By filtering responses by customer type, you can identify which groups are your strongest promoters—and which may need targeted improvements to enhance their experience.
#2 Understand How NPS is Measured
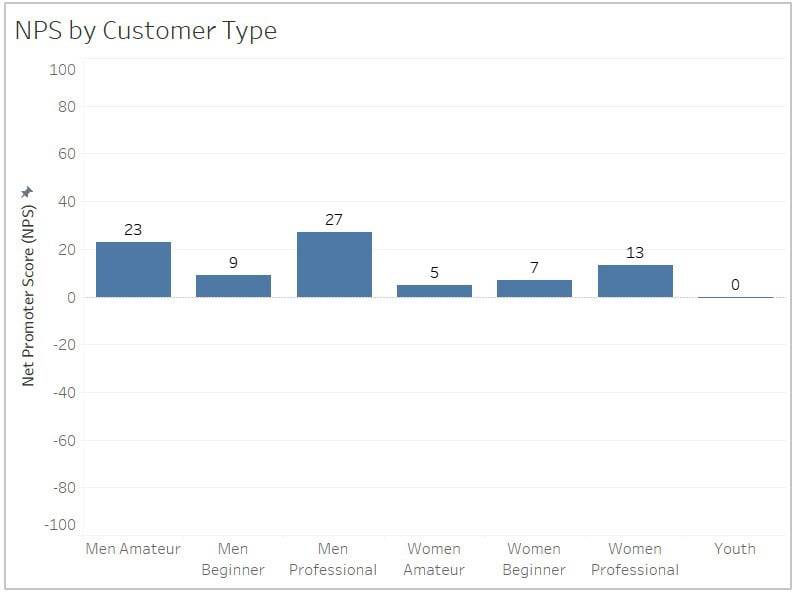
It’s common to look at companies like USAA and Apple who have an NPS in the 70s and think your company should be receiving a similar score. For our fictitious golf equipment company, you can see their NPS rating by each customer type. At first glance, this graph may look odd, but keep in mind that the NPS can range from -100 to 100. Companies that report their NPS publicly often ensure that a third party conducts the survey to maintain objectivity and credibility. Proper NPS surveys also follow best practices—such as surveying a representative sample, ensuring anonymity, and asking the question consistently across customer touchpoints.
3. Segment Your Customer Type by NPS Categories
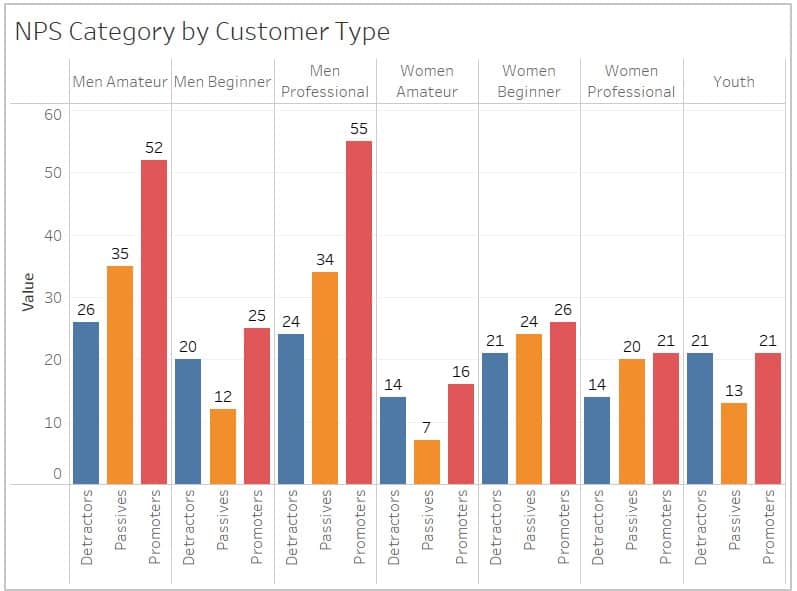
You’ve already seen the value of segmenting your NPS data by customer type. The next level of segmentation is breaking it down further by NPS category. An NPS score ranges from 0 to 10, which is divided into three categories: Promoters (9-10), Passives (7-8), and Detractors (0-6). The chart below makes it easy to identify each of these groups.
#4 Understand the Impact of Detractors and Passives
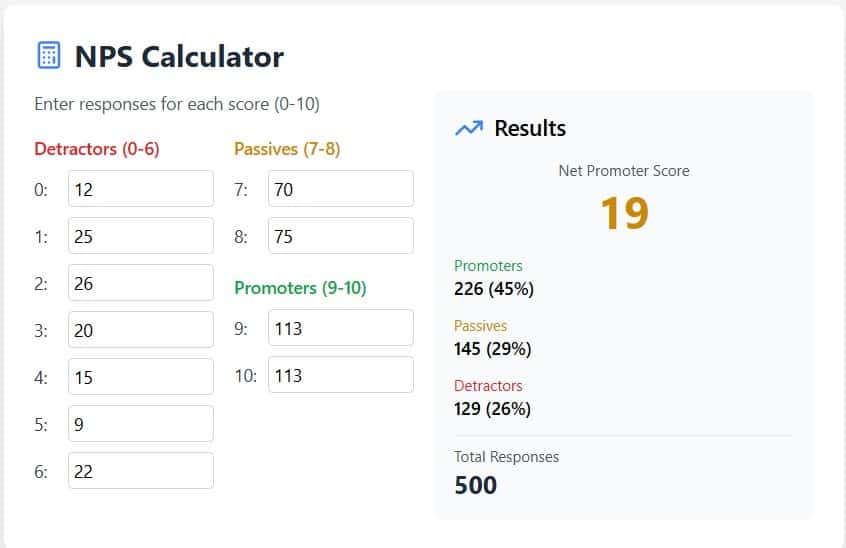
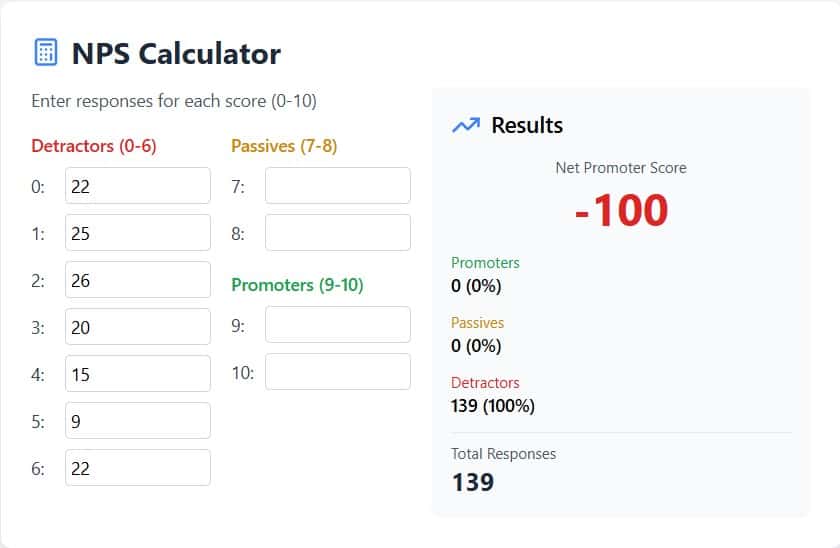
You can calculate your NPS and experiment with the numbers using my NPS calculator.
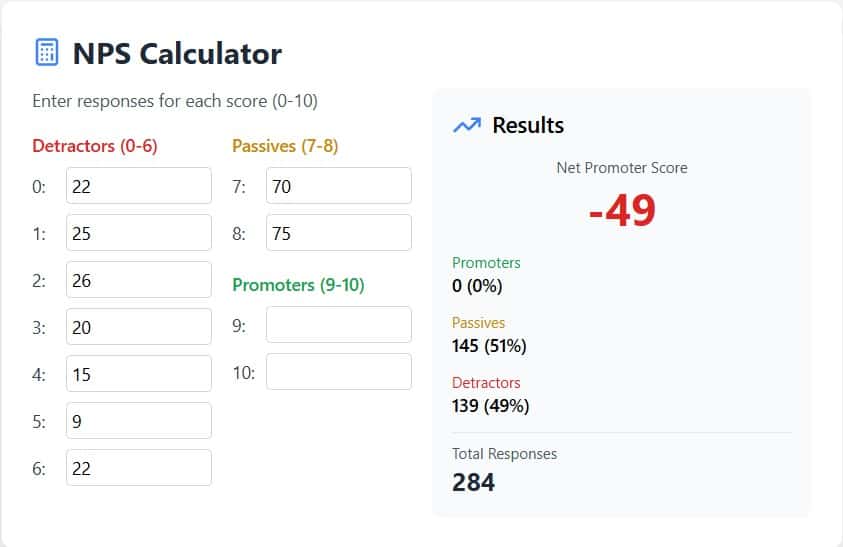
In the first screenshot, notice how, by entering only Detractor scores (those from 0-6), the NPS results in -100. This makes sense, as there are no Promoters to offset the Detractors. Without any Passives or Promoters, your NPS will always be negative if there are enough Detractors.
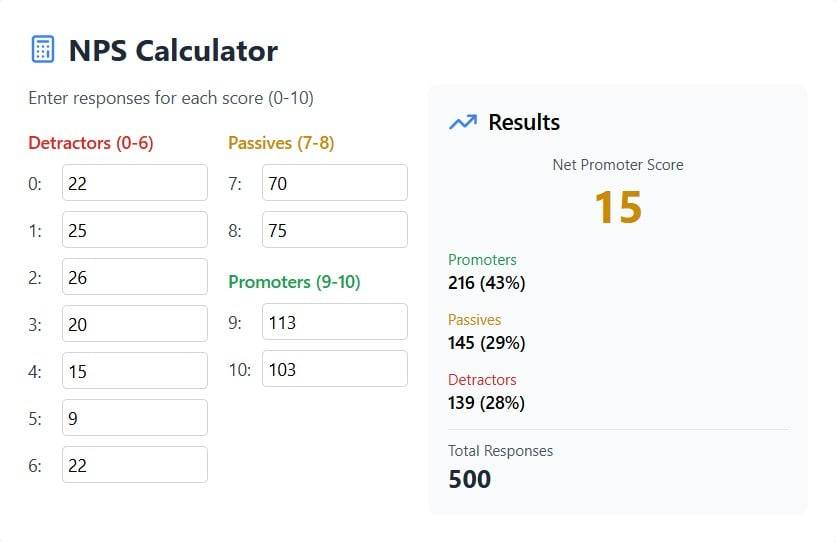
Passives also don’t directly affect the NPS calculation formula, but they do influence the percentage calculations as you can see in the second screen show below. When you add more Passives, it changes the total number of respondents and alters the percentages of Promoters and Detractors relative to the overall sample size. This ultimately shifts the final NPS result. Finally, the third screen shot shows the NPS for Fairway to Heaven Golf including all Detractors, Passives, and Promoters.
Just remember, the NPS calculation formula is: NPS = % of Promoters – % of Detractors
#5 Converting Detractors and Passives
One of the nice things about this NPS calculator is how easy it is to perform real-time what-if analysis. What would be the impact if 10 Detractors became Passives? Would that differ from 10 Passives becoming Promoters? The math for both of these scenarios is the same: your NPS increases from 15 to 17. However, if 10 Detractors become Promoters, this results in your NPS increasing to 19, as shown in the screenshot below.
By understanding and applying these five powerful insights, you can transform your NPS survey data from just numbers into actionable strategies that directly improve customer satisfaction and loyalty. Segmenting by customer type and NPS categories, understanding the impact of Detractors and Passives, and exploring how changes in these groups affect your overall NPS will give you a deeper understanding of where to focus your efforts. Whether it’s addressing the needs of specific customer segments or strategically converting Detractors into Promoters, each of these insights empowers you to take concrete steps toward creating a better customer experience.
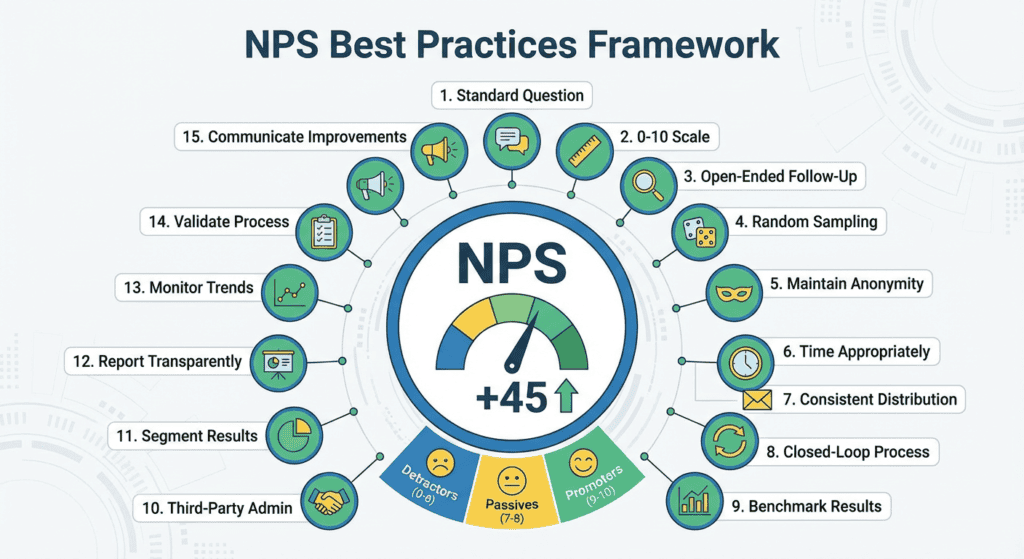
To ensure your Net Promoter Score (NPS) process is valid, reliable, and capable of withstanding external stakeholder scrutiny, follow these best practices outlined by Fred Reichheld and other NPS experts:
1. Use the Standardized NPS Question
The NPS methodology is built around a single question: “How likely are you to recommend [Company/Product] to a friend or colleague?” This ensures consistency and comparability across industries and organizations.
Ask respondents to explain their score with a follow-up question like: “What is the primary reason for your score?” This provides actionable insights beyond the numerical score.
4. Ensure Random Sampling for Valid Results
To avoid bias, ensure your survey reaches a representative sample of your customer base. Random sampling prevents skewed data that might misrepresent customer sentiment.
5. Maintain Anonymity for Honest Feedback
Ensure respondents feel safe sharing honest opinions. Communicate that responses will remain anonymous, which encourages candid feedback.
6. Time the Survey Appropriately
Send surveys at key moments in the customer journey, such as:
After a purchase.
Following a customer service interaction.
Periodically during the customer lifecycle.
Timing should align with moments that are likely to influence customer perceptions.
7. Use a Consistent Survey Distribution Method
Stick to a single channel (email, SMS, in-app, etc.) for consistent results, or clearly segment results by distribution method to avoid mixing data from different channels.
8. Act on Feedback with a Closed-Loop Process
Respond promptly to detractors to resolve issues and improve their experience. Thank promoters and encourage them to share testimonials. This demonstrates that customer feedback leads to real action.
9. Benchmark Your NPS
Compare your score to industry benchmarks and your historical performance. Use third-party resources like NPS Benchmarks to contextualize your results.
10. Engage a Third Party for Administration
Using a third-party service to administer the survey can ensure objectivity, reduce bias, and reassure external stakeholders of the process’s integrity.
11. Segment Your NPS Results
Analyze scores by customer demographics, regions, or product lines. Segmentation helps identify specific areas of strength and weakness.
12. Report Results Transparently
Present NPS findings to management and external stakeholders in a clear and transparent way. Include:
Overall score.
Segmented insights.
Verbatim customer feedback.
Actions taken based on feedback.
13. Monitor Trends Over Time
Track your NPS over months or years to measure the impact of changes in your business. Look for patterns in promoter and detractor behavior.
14. Validate Your NPS Process
Regularly audit your NPS process to ensure it aligns with best practices. Validate that:
Sampling is unbiased.
Scales and questions are used consistently.
Feedback is acted upon.
15. Communicate Improvements to Customers
Close the feedback loop with customers by letting them know how their input has led to tangible improvements. This reinforces trust and encourages future participation.
By following these best practices, you can ensure that your NPS process is robust, actionable, and credible in the eyes of both internal and external stakeholders.
“Loyalty is the willingness of someone—a customer, an employee, a friend—to make an investment or personal sacrifice to strengthen a relationship.”
“The primary purpose of a business should be to enrich lives. When you do that, profits follow.”
“Feedback is only valuable when it leads to action that improves experiences and builds trust.”
Book Theme
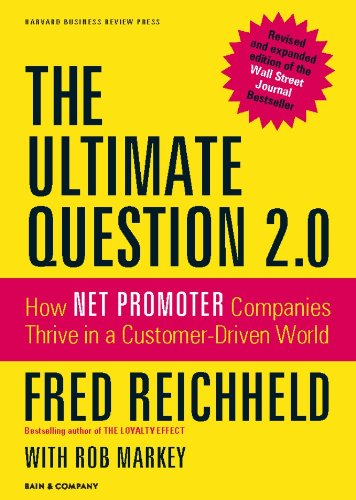
The Ultimate Question 2.0 explores how organizations can achieve sustainable growth and customer loyalty by focusing on customer feedback, specifically through the Net Promoter System (NPS). It emphasizes the power of customer-centric strategies to drive business success.
Why You Should Read This Book
This book is essential for business leaders, marketers, and customer experience professionals looking to:
Build a loyal customer base.
Learn practical ways to implement the Net Promoter System (NPS).
Understand the direct connection between customer feedback and business growth.
Shift from a transactional to a relationship-focused business model.
Key Ideas and Arguments Presented
The Power of NPS
Enriching Lives Drives Success
Customer-Centric Culture
Actionable Feedback
Promoters vs. Detractors
The Economic Impact of Loyalty
Employee Engagement and Loyalty
Case Studies and Examples
Criticisms and Misuse of NPS
The Virtuous Cycle of Loyalty
Book Outline
The Ultimate Question
The Net Promoter System
Building a Customer-Centric Culture
Case Studies of Success
Overcoming Challenges with NPS
The Future of Customer Loyalty
Key Takeaways
The Net Promoter System is more than a metric; it’s a philosophy for business success.
Loyalty is the foundation of sustainable growth.
Companies must integrate customer feedback into their culture to thrive.
Key Techniques
Net Promoter System (NPS): A methodology to measure and act on customer loyalty.
Closed-Loop Feedback: A process to follow up with customers and address their concerns.
Promoter Activation: Strategies to encourage promoters to refer others.
Author’s Qualifications
Fred Reichheld is a renowned business strategist and author, best known for his work on customer loyalty and the development of the Net Promoter System. He is a Fellow at Bain & Company, where he has spent decades advising companies on growth and customer experience.
The book has been praised for its actionable insights and real-world examples. Critics have highlighted its simplicity and effectiveness but have noted that NPS is not a one-size-fits-all solution.
One Sentence Takeaway
The Net Promoter System is a transformative approach to achieving customer loyalty and sustainable growth by focusing on enriching lives and acting on feedback.