Last updated June 2026
How do you know if 100 likes on a post is a lot or a little? The answer lies in context. Key performance indicators (KPIs) are the metrics that matter for social media success, and industry benchmarks give you that all-important context for evaluating your performance.
In today’s rapidly evolving social media landscape, understanding these benchmarks helps marketers set realistic goals and gauge where they stand against the competition. Below is a summary of the top social media KPIs and their average benchmarks using data from 2024, followed by a deeper dive into each metric.
| KPI | 2024 Benchmarks |
|---|---|
| Engagement Rate | Facebook ~1.2%, Instagram ~3.5%[1] X (Twitter) ~0.14%[2], TikTok ~5.7%[3] |
| Reach Rate (Organic) | Instagram ~4.0%, Facebook ~2.6%[4] |
| Audience Growth Rate (Monthly) | Instagram ~1.7%, Facebook ~0.7%, X ~0.3%[5] |
| Click-Through Rate (CTR) | Facebook ads ~1.6% CTR (avg)[6] |
| Cost Per Click (CPC) | Facebook ~\$0.77, LinkedIn ~\$5.00 TikTok/Instagram ~\$0.50–\$0.60[9] |
| Conversion Rate | Facebook lead-gen ads ~9%[7] Generally, >3% is considered good[8] |
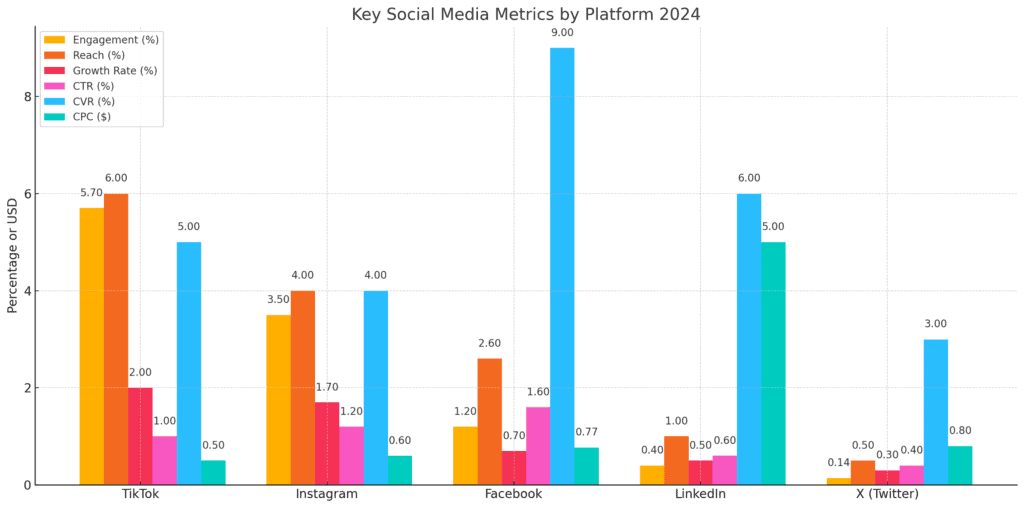
To help you benchmark your performance more easily, here’s a side-by-side chart of the most important social media metrics by platform—including engagement, reach, growth rates, click-through rates, conversion rates, and ad costs.
Engagement Rate
What it is: Engagement rate measures how actively your audience interacts with your content. It’s usually expressed as the percentage of people who engaged (likes, comments, shares, etc.) out of those who saw the content. Some marketers calculate it as engagements divided by total followers, while others use engagements divided by reach (unique viewers) for a more precise rate.
Why it matters: Engagement rate is a key indicator of content resonance. High engagement means your content is striking a chord with your audience, which in turn can boost visibility via platform algorithms. It’s a comparative metric too—a 2% engagement rate might be average on one platform but excellent on another.
Benchmarks: Engagement levels vary by platform. For example, Instagram’s average engagement rate is around 3.5%, significantly higher than Facebook’s ~1.2%[1]. TikTok leads in this area with roughly a 5%+ engagement rate[3], reflecting its highly interactive user base. By contrast, X (Twitter) sees only about 0.1% engagement on average[2], indicating that interaction is much harder to come by. Keep in mind that overall social media engagement has been on a downward trend for some networks, so creating compelling content is more important than ever to maintain strong engagement.
Reach and Impressions
What it is: Reach is the number of unique users who see your post, whereas impressions count total views (including multiple views by the same user). Essentially, reach answers “how many people saw it?” and impressions answer “how many times was it seen?”
Why it matters: These metrics tell you the size of the audience your content is actually hitting. With algorithms limiting organic exposure, not all your followers will see every post. Tracking reach (often presented as a percentage of your follower count, known as reach rate) helps you understand how content distribution is performing. Impressions can indicate how viral or frequently shared a piece of content became beyond the initial audience.
Benchmarks: Organic reach is notably low across major platforms. On Facebook, an average post might reach only about 2.6% of your page’s followers, and on Instagram around 4.0%[4]. In other words, out of 1,000 followers, only a few dozen may see a given post. This underscores the importance of optimizing content timing and quality to extend reach. Impressions tend to be 1–2x higher than reach on content that gets reshared or viewed multiple times, but reaching even a fraction of your follower base is an achievement under current algorithms. Many brands also utilize paid promotion to combat declining organic reach.
Audience Growth Rate
What it is: Audience growth rate measures how quickly you’re gaining (or losing) followers over time. It’s often expressed as a monthly percentage growth. For example, if you had 10,000 followers and gained 300 in a month, that’s a 3% monthly growth rate.
Why it matters: This KPI reflects your brand’s expanding reach and popularity on social media. A healthy growth rate means your content and social presence are attracting new people consistently. If growth is stagnant or negative, it may signal the need to adjust your strategy or content mix to appeal to new audiences.
Benchmarks: Growth rates on established platforms are generally modest. Across industries, Instagram pages grow by around 1.5–2% per month on average, whereas Facebook pages see closer to ~0.5–0.7% monthly growth[5]. Twitter (X) tends to be slower still, often around 0.3% per month[5]. These are average figures; a strong campaign or viral content can spike your growth well above the baseline (for example, a trending TikTok account might explode with followers in a short time). Comparing your growth rate against these benchmarks helps set realistic expectations. For instance, doubling your followers in a year on a mature platform would be an achievement since it implies ~8% monthly growth sustained over 12 months.
Click-Through Rate (CTR)
What it is: CTR is the percentage of people who click on a link or call-to-action in your social media post or ad. It’s calculated as (clicks ÷ impressions) × 100%. For organic posts, this might apply to links in your content (e.g. “Learn more” or a blog post link). In social advertising, CTR is a critical metric for ad effectiveness.
Why it matters: CTR shows how compelling your content and offers are at driving action. A higher CTR means more of your audience was enticed to “swipe up,” “click the link,” or otherwise engage with your call-to-action. This often translates directly into traffic for your website or landing page. Monitoring CTR helps you gauge the effectiveness of your messaging, creative, and targeting. If impressions are high but CTR is low, your content might not be resonating or the call-to-action isn’t convincing.
Benchmarks: Click-through rates on social content are typically in the low single digits. For example, Facebook ads average around a 1.6% CTR across industries[6]. That means out of 100 impressions, only one or two people click through on average. On organic posts, CTR can vary widely depending on content type (a meme vs. a link post) and platform (links on Twitter often see well under 1% click rates, for instance). Anything above a few percent is usually considered a strong CTR in the social media context. Improving CTR can involve tweaking your copy, visuals, or audience targeting to better entice viewers to take that next step.
Conversion Rate
What it is: Conversion rate is the percentage of users who take a desired action after clicking through your social content. That action could be making a purchase, signing up for a newsletter, filling out a lead form, or any defined goal. In the context of social media marketing, conversion rate often tracks how many of the people who come to your website from social actually convert into leads or customers.
Why it matters: This is the bottom-line metric that connects social media efforts to business outcomes. You might have a million impressions and thousands of clicks, but if none of those clicks convert into meaningful results, the campaign hasn’t delivered real value. Monitoring conversion rate helps you assess the quality of traffic and the effectiveness of your landing pages or social commerce funnels. It also informs ROI calculations for social media marketing.
Benchmarks: Conversion rates vary drastically by platform and industry, but we can look at a few benchmarks. Facebook’s dedicated lead-generation ads, for example, have an average conversion rate around 9%[7] (meaning about 1 in 11 clickers complete the lead form). In contrast, driving eCommerce sales from cold social media traffic will usually see lower conversion percentages. As a general rule of thumb in social media marketing, anything above about 3% is often considered a good conversion rate[8]. Keep in mind that “good” is relative as some industries or campaign types naturally convert at higher rates than others. The key is to track your own conversion metrics over time and strive to beat both your past performance and relevant industry benchmarks.
In summary, knowing these KPIs and their benchmarks equips you to critically evaluate your social media performance. Use these numbers as reference points: if your metrics are lagging far behind industry averages, it’s a signal to refine your strategy, and if you’re exceeding benchmarks, it’s a sign you’re doing something right. But remember—your best benchmark is often your own progress. Improvement over time shows that your strategy is working, even if you’re still catching up to broader averages. By continuously monitoring and comparing your KPIs against both industry standards and your own historical data, you can make informed, data-driven decisions to improve your social media marketing outcomes in 2024 and beyond.
- Socialinsider – Social Media Reach: Statistics For 2024.
- Brandwatch – Cross-Industry Social Media Benchmarks (2024).
- Rival IQ – 2023 Social Media Industry Benchmark Report.
- Socialinsider – Social Media Reach: Statistics For 2024.
- Brandwatch – Cross-Industry Social Media Benchmarks (2024).
- WordStream – Facebook Ads Benchmarks 2024.
- WordStream – Facebook Ads Benchmarks 2024.
- Shopify – How to Improve Your Social Media Conversion Rate (2025).
- WordStream – Facebook Ads Benchmarks 2024.