
Last updated June 2026
Chrome DevTools can look like developer territory, but marketers do not need to be developers to use it. If you have ever wondered whether a pixel fired, why attribution dropped, or why a form behaves differently for different visitors, DevTools gives you browser-level evidence.
If you have worked in Google Tag Manager, Google Analytics 4, paid media platforms, or website analytics tools before, you already have enough context to use most of what is covered here.
That is the important shift. You are not guessing from a dashboard. You are looking at what the browser actually requested, received, stored, blocked, or warned about.
How to Open Chrome DevTools
The friendliest way to start is the one many marketers already use.
Option 1: Right-click and Inspect.
Right-click anywhere on the web page and choose Inspect. This opens DevTools directly inside Chrome.
Option 2: Use a keyboard shortcut
Windows: Ctrl + Shift + I or F12.
Mac: Cmd + Option + I.
The Simple Mental Model
Think of DevTools as four lenses. Each one answers a different marketing question.
Network
Did the tag, pixel, form, script, or redirect actually happen.
Console and Issues
Did Chrome detect an error, warning, blocked script, cookie issue, or mixed content problem.
Application
Were cookies, local storage, consent settings, or other browser storage values created correctly.
Performance
Is the web page slow, unstable, or overloaded by scripts that hurt the visitor experience.
Two Rules Before You Start
First, open DevTools before you reproduce the problem. If you open it after the form submit, checkout step, or redirect, the evidence may already be gone.
Second, turn on Preserve log in the Network panel. Many marketing flows move from one web page to another. Preserve log keeps the request history from disappearing during that navigation.
10 Practical DevTools Checks for Marketers
These are the DevTools checks I would prioritize first. You do not need to learn every panel. You need to know which panel answers which marketing question.
1. Verify that a pixel or event actually fired
Start in Network.
Dashboards can lag, sample, or hide details. The Network panel shows whether the browser sent the request at all.
- Open DevTools and choose the Network panel.
- Turn on Preserve log.
- Reload the web page or perform the action, such as a form submit or purchase.
- Filter by a vendor domain or keyword such as
collect,gtm,pixel, ordoubleclick. - Click the matching row and confirm it fired at the right time.
You may find that the event never fired, fired too early, fired too late, or fired more than once.
2. Confirm that the request payload has the right values
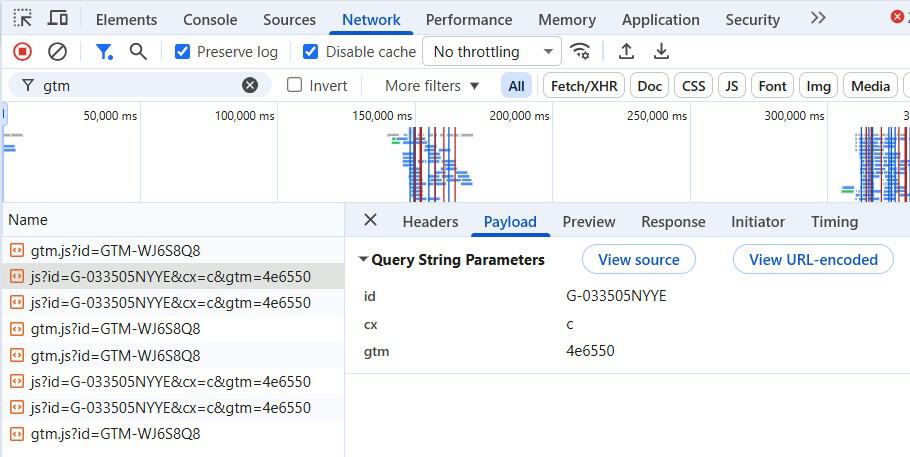
Start in Network, then check Headers and Payload.
Many tracking problems are not missing-hit problems. They are bad-data problems. The event may fire, but it may send the wrong value.
- Click the request that looks like your analytics or ad platform hit.
- Check the status code in Headers.
- Open Payload and review fields like event name, revenue, currency, product IDs, lead ID, or deduplication ID.
- Use the search box if you need to find one parameter quickly.
You may find that a purchase event fired, but revenue is missing or the wrong currency was sent.
3. Identify what triggered a request
Start in the Network Initiator column.
This helps you route the issue. Is it a tag manager problem, a developer problem, a vendor script problem, or a consent problem.
- Find the request in Network.
- Look for the Initiator column.
- Open the request details if you need more context.
- Right-click the request and choose Copy as fetch or Copy as cURL if a developer asks for more detail.
You may discover that GTM loaded correctly, but a JavaScript error stopped the custom event from being pushed.
4. Debug redirects that strip UTMs or click IDs
Start in Network with Preserve log turned on.
Redirects can silently remove UTMs, gclid, msclkid, or referrer information. That can make attribution look broken even when the campaign was tagged correctly.
- Open Network and turn on Preserve log.
- Paste the full campaign URL into the address bar.
- Watch each redirect step in the request list.
- Confirm the final landing URL still includes the needed parameters.
- Repeat once with Disable cache checked.
You may find that the first redirect preserves UTMs, but a second redirect drops them.
5. Test like a first-time visitor
Start in Network and Application.
Your browser has history. It may have cached scripts, accepted cookies, or saved consent choices that a new visitor does not have.
- In Network, check Disable cache.
- Reload the web page while DevTools is open.
- For a cleaner test, go to Application and use Clear site data.
- Run the flow again and compare the result.
You may find that tracking works for returning visitors but fails before a new visitor accepts consent.
6. Find where a tag is installed or duplicated
Start in Search and Elements.
Tags may be injected by GTM, a consent platform, a plugin, a theme, or an old hardcoded snippet. Duplicate installs can inflate reporting.
- Use Global Search with Ctrl + Shift + F on Windows or Cmd + Option + F on Mac.
- Search for a container ID, pixel ID, vendor domain, or script name.
- Click a match to see where it appears.
- Use the Elements panel to see what is actually rendered in the browser.
You may find an old pixel snippet loading alongside the GTM-managed version.
7. Audit cookies, storage, and consent state
Start in Application and Issues.
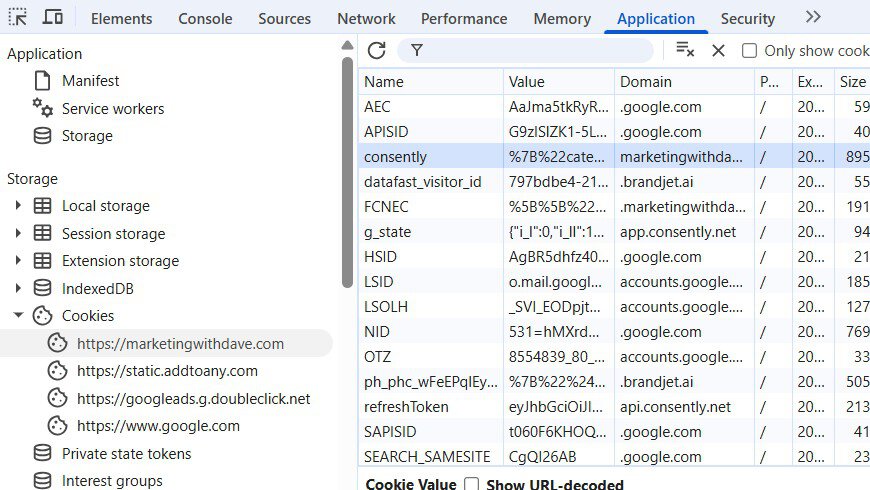
Measurement often depends on cookies, consent state, local storage, and browser rules. If storage is wrong, attribution can break even when the event fires.
- Open Application.
- Check Cookies for the domain you are testing.
- Check Local Storage for consent-related keys.
- Review the Issues panel for cookie warnings.
You may see that the conversion request fired, but the identifying cookie was missing or blocked.
8. Catch JavaScript errors and browser warnings
Start in Console, Issues, and Security.
A single JavaScript error can stop a form, block an event, or prevent a tag from firing.
- Open the Console panel.
- Reload the web page and watch for red errors.
- Use Preserve log in Console if the flow navigates to another web page.
- Check Issues and Security for cookie problems, mixed content, or blocked resources.
You may find that a form submit fails because an unrelated script error stops the event from completing.
9. Simulate mobile and slower real-world conditions
Start in Device Mode, Network throttling, and Performance.
Your desktop connection is not your customer’s phone. Slower conditions expose problems that clean office testing misses.
- Toggle Device Mode with Ctrl + Shift + M on Windows or Cmd + Shift + M on Mac.
- Choose a mobile viewport.
- Throttle the network from the Network panel.
- Test landing, scrolling, CTA clicks, form submits, and checkout steps.
You may find that a widget or third-party script makes the web page feel fine on desktop but painful on mobile.
10. Find what is slowing the web page down
Start in Performance, Coverage, and Lighthouse.
Slow landing web pages are often caused by heavy scripts, layout shifts, blocking resources, or unused code.
- Open the Performance panel.
- Record a trace around the part of the experience that feels slow.
- Use Coverage to spot unused JavaScript and CSS.
- Use Lighthouse if you need a score that is easier to share with stakeholders.
You may find a layout shift pushing the CTA down, or a marketing library shipping unused code to every visitor.
Cheat Sheet: Problem to Panel
| Marketing problem. | Start here. | What to look for. |
|---|---|---|
| Pixel or event not firing. | Network. | Request exists, timing, status code, and payload. |
| Wrong parameters or missing revenue. | Network. | Payload fields, event name, revenue, IDs, and request details. |
| Attribution drop after consent or privacy changes. | Application and Issues. | Cookie presence, consent state, storage values, and cookie warnings. |
| UTMs or click IDs missing on the final landing URL. | Network. | Redirect chain with Preserve log enabled. |
| Tag blocked or script errors. | Console, Issues, and Security. | JavaScript errors, blocked resources, mixed content, and browser warnings. |
| Landing web page feels slow on mobile. | Device Mode and Performance. | Mobile layout, throttling, heavy scripts, unused code, and Core Web Vitals signals. |
What Is a HAR File and Why Developers Ask for One
A HAR file is an export from the browser’s Network panel. HAR stands for HTTP Archive. In plain English, it is a record of the requests and responses that happened while you tested a web page.
A HAR file can show redirects, request timing, status codes, headers, and other details that help a developer understand what happened in the browser. That is why it can be useful when a pixel does not fire, a redirect strips UTMs, a form fails, or a request returns an error.
Important: HAR files can contain sensitive information, including cookies, tokens, account IDs, email addresses, private URLs, and other data. A sanitized HAR means you review the file and remove sensitive information before sharing it with anyone else.
What to Send a Developer
Developers usually want the same thing you want: a faster fix. DevTools helps you give them evidence instead of a vague “it is broken” report.
- Exact URL and whether it is production, staging, or a test environment.
- Short numbered steps to reproduce.
- Expected behavior versus actual behavior.
- Timestamp, time zone, and whether you tested in an incognito window.
- Chrome version, operating system, login state, and consent choice.
- Sanitized HAR file from the Network panel, when appropriate.
- Specific request row details, status code, and Copy as fetch or Copy as cURL if requested.
- Console or Issues screenshots with Preserve log enabled if navigation is involved.
Image Checklist for Your DevTools Screenshots
For the most useful Network screenshot, capture the screen after a real action such as a form submit or purchase. Try to show Preserve log, Disable cache if relevant, the filter term, one highlighted request row, status code, type, size, time, and the Headers or Payload tab.
Before publishing, blur or crop anything sensitive such as email addresses, cookies, tokens, order IDs, account IDs, or private URLs.
Where to Start
Do not try to learn every panel at once. Start with one critical flow and build confidence from there.
- Pick one flow, such as a lead form, checkout, newsletter signup, or ad landing web page.
- Open DevTools before the test and turn on Preserve log.
- Run the flow once and look for the key analytics or ad request in Network.
- Check the Payload to confirm the important values are present.
- Save a sanitized HAR or screenshot so you have baseline evidence for future troubleshooting.

