
Last updated March 2026
Quick summary: LinkedIn does not provide an export for personal follower analytics, but the Creator Audience analytics view supports custom date ranges. By generating monthly links with Excel formulas, you can capture cumulative new followers by month and build a trend dataset for dashboards and reporting.
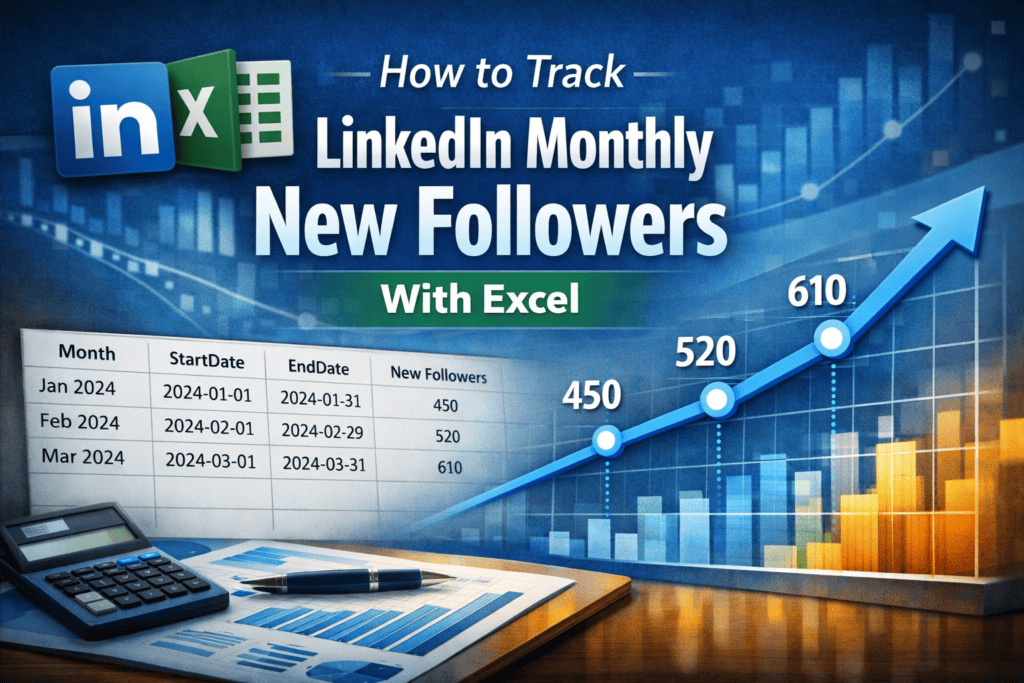
LinkedIn’s Creator Audience view can show cumulative follower growth over custom date ranges, and it often provides a deeper lookback window than other profile metrics (which frequently only go back about a year). This quick Excel hack helps you generate a clickable URL for every month so you can capture monthly new followers in minutes and build a trend dataset for Tableau, Excel charts, or reporting.
In this tutorial, you will:
1. Create a simple Excel table with month start and end dates
2. Automatically generate correct month boundaries, including leap years
3. Build a monthly LinkedIn Creator Analytics link for each month
4. Capture monthly new follower totals from the cumulative chart
Important note about this method
This is not an officially documented LinkedIn export feature. It is a repeatable workflow based on how LinkedIn’s Creator Audience analytics URL parameters behave in the browser. LinkedIn can change these parameters or the analytics experience at any time. Use this as a practical workaround for building your own dataset.
What you need
1. A LinkedIn account with access to Creator Analytics
2. A desktop browser (recommended)
3. Excel or Google Sheets (Excel formulas below)
4. A place to record monthly results (a spreadsheet is perfect)
Step 1: Confirm you can access the Creator Audience analytics view
Open LinkedIn in a desktop browser while logged in, then paste this into your address bar:
https://www.linkedin.com/analytics/creator/audience
If you can see an audience analytics view, you are in the right place. If you do not have access, you may need to enable Creator Mode or you may not have this feature available in your account.
Step 2: Understand the URL pattern we will generate in Excel
LinkedIn’s Creator Audience analytics supports custom date ranges via URL parameters. The key parameters used in this workflow are:
startDate=YYYY-MM-DD
endDate=YYYY-MM-DD
timeRange=custom
lineChartType=cumulative
We will use Excel to generate a monthly link for each month so you can open the link, confirm the date range, and capture the cumulative new follower value for that month.
Step 3: Set up your Excel table
Create a new Excel sheet with these column headers:
A: Month
B: StartDate
C: EndDate
D: Link
E: New Followers (entered manually)
In cell B2, enter the first month start date you want to track. Example:
2024-01-01
Make sure columns B and C are formatted as dates.
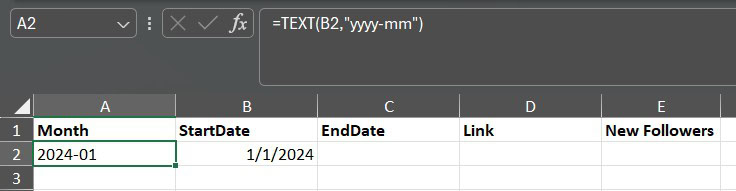
In cell A2, generate your Month label from the StartDate. This helps with sorting and makes the table easier to scan while you build it.
Option 1 (best for Tableau sorting):
=TEXT(B2,”yyyy-mm”)
Option 2 (more readable):
=TEXT(B2,”mmm yyyy”)
You can copy the Month formula down after you fill your StartDate column in the next step.
Step 4: Generate the next month StartDate automatically
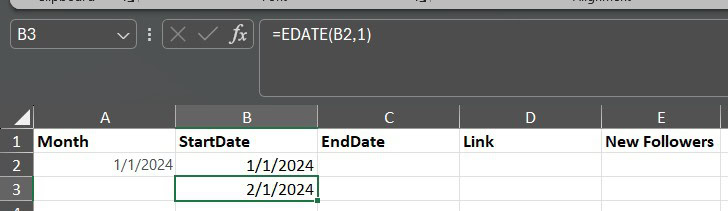
In cell B3, enter this formula:
=EDATE(B2,1)
Copy B3 down to generate future months. This advances by exactly one calendar month and handles year changes automatically.
Step 5: Generate the month EndDate automatically
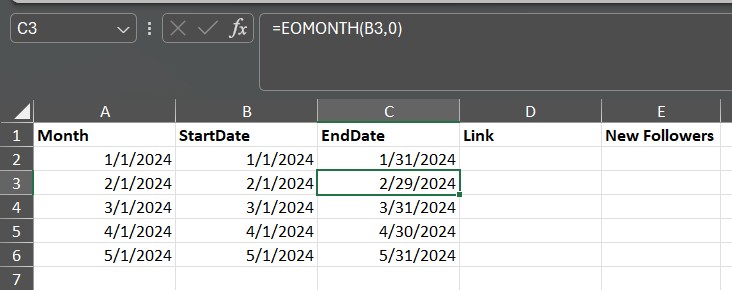
In cell C2, enter this formula:
=EOMONTH(B2,0)
Copy C2 down for all rows. This automatically returns the last day of each month, including February 29 during leap years.
Step 6: Create a clickable monthly analytics link
In cell D2, use this formula to generate a clean, clickable link labeled Open:
=HYPERLINK(“https://www.linkedin.com/analytics/creator/audience/?startDate=”&TEXT(B2,”yyyy-mm-dd”)&”&endDate=”&TEXT(C2,”yyyy-mm-dd”)&”&timeRange=custom&lineChartType=cumulative”,”Open”)
Copy D2 down for all rows.
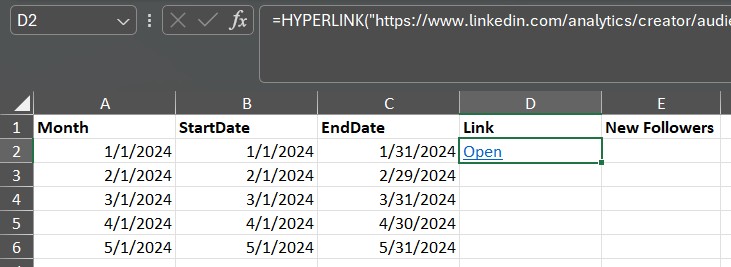
Copy A2 down for all rows.
Step 7: Capture monthly new follower totals
For each month (each row):
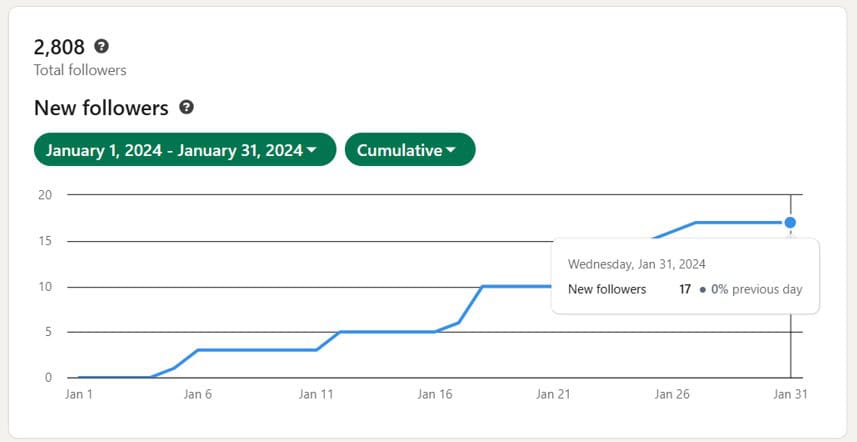
- Click the Open link in column D
- Confirm the date range matches the month you are tracking
- Confirm the chart is in cumulative mode
- Hover the last point on the chart and record the cumulative new follower value
- Enter that value in column E (New Followers)
Recommended tracking protocol
To keep your dataset consistent, run this process on the first day of each month for the prior month. Example: capture January’s value on February 1. If you do it mid-month, your interpretation of month-to-month changes becomes less clean.
How to use the dataset
Once you have monthly values, you can:
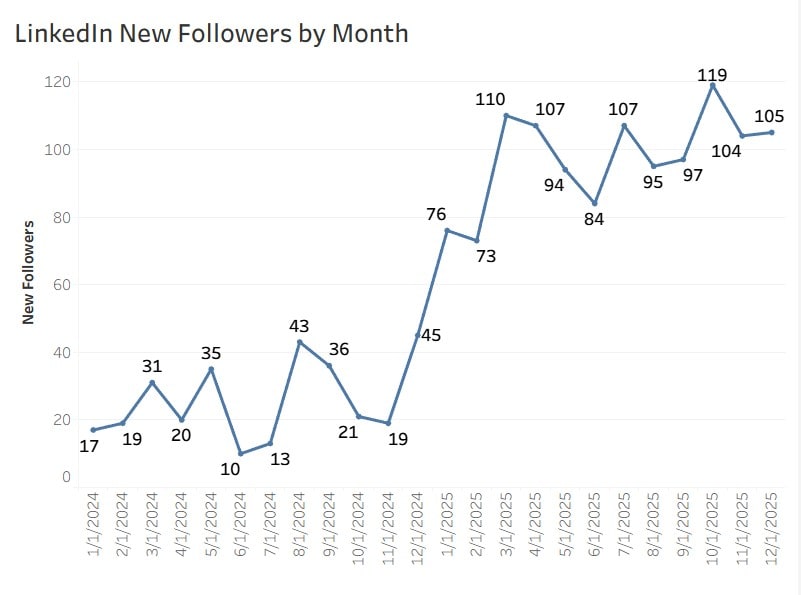
1. Create a line chart of New Followers by Month
2. Add a rolling 3-month average to smooth spikes
3. Compare follower growth to your posting frequency (if you track it)
4. Use the dataset in Tableau for a dashboard and blog content
Common troubleshooting
1. Excel shows numbers like 45322 instead of a date
This usually means the cell is formatted as a number. Change the column format to a date (Home menu, Number format, choose Short Date or Date).
2. The link opens but the date range does not look right
Make sure your StartDate and EndDate cells are true dates, and confirm the TEXT format in the formula is exactly yyyy-mm-dd.
3. You cannot access the Creator Audience analytics view
Your account may not have Creator Analytics enabled or available. Try enabling Creator Mode and then revisit the URL.
4. You do not see cumulative mode
LinkedIn occasionally changes analytics UI elements. If the view still shows follower growth but the cumulative toggle looks different, capture the monthly total using the last visible value in the chart.
Limitations to understand up front
LinkedIn personal profile analytics are not designed for exporting and trending. This method works best for follower growth because the Creator Audience view can provide a deeper history window than other profile metrics. Other personal profile metrics may not support consistent month-by-month extraction and may only be visible for shorter windows.
If you build a dashboard from this, document your capture schedule and save occasional screenshots so you have a clear audit trail for how the dataset was created.
Frequently asked questions
Does LinkedIn provide an official export for follower analytics?
No. Personal profile analytics do not currently support any export options. This method uses the Creator Audience analytics view with custom date ranges.
Does this work for company web pages?
Company web pages have built-in analytics exports. This method is most useful for personal profiles where export is not available.

