Last updated October 2026
What Marketing Knew Before the Internet (And Quietly Forgot)
Most people only buy textbooks when a professor requires them. I actually enjoy hunting for old marketing textbooks at thrift stores.
There’s something fascinating about reading Philip Kotler and other marketing thinkers before the internet, social media, and today’s endless stream of marketing technology. The tools were different, but the underlying principles were often remarkably clear.
What surprises me most is how much I still discover. Despite years of studying and practicing marketing, I regularly come across frameworks, models, and concepts I’ve never encountered, or haven’t thought about in years.
Recently, I picked up a 1985 marketing textbook and started photographing pages that caught my attention. Some ideas feel dated. Others are surprisingly relevant, and a few have challenged how I think about marketing today.
This article is a collection of those discoveries, what the original frameworks taught, what has changed, and what might still be worth learning.
Situational Analysis Comes First, and It Never Ends
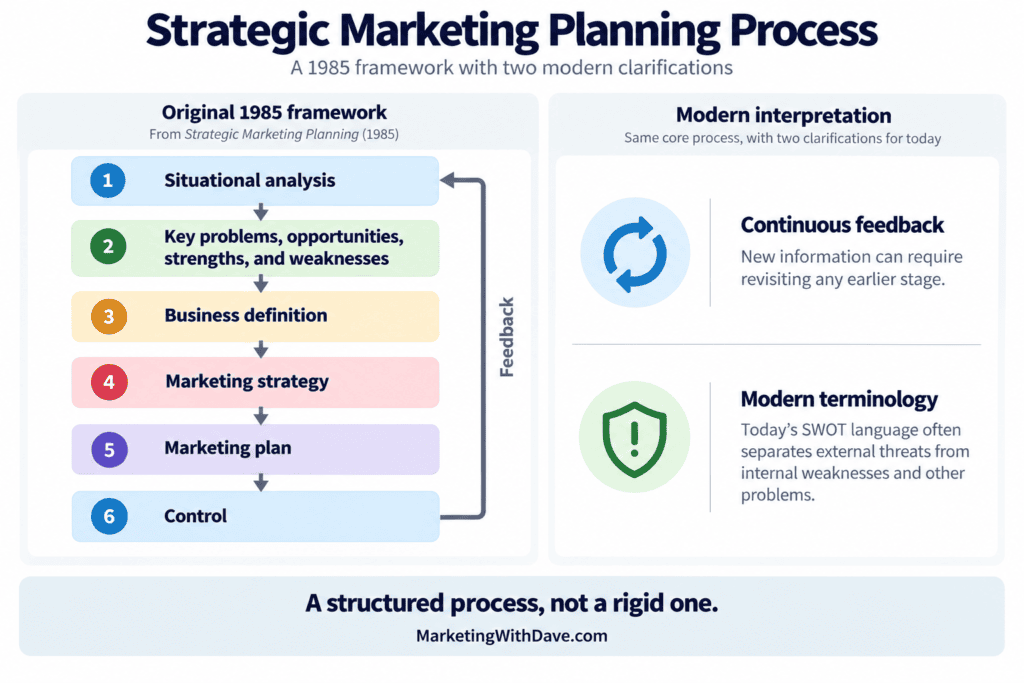
Should situational analysis still precede strategy? Yes. Strategy without situational understanding is preference dressed up as a plan.
The update is that it is no longer a one-time step. Markets change faster, distribution shifts faster, and performance signals arrive in near real time. Situational analysis and control should feed each other continuously. Treat it as sensing, not an annual ritual.
SWOT: The Difference Between Problems and Threats
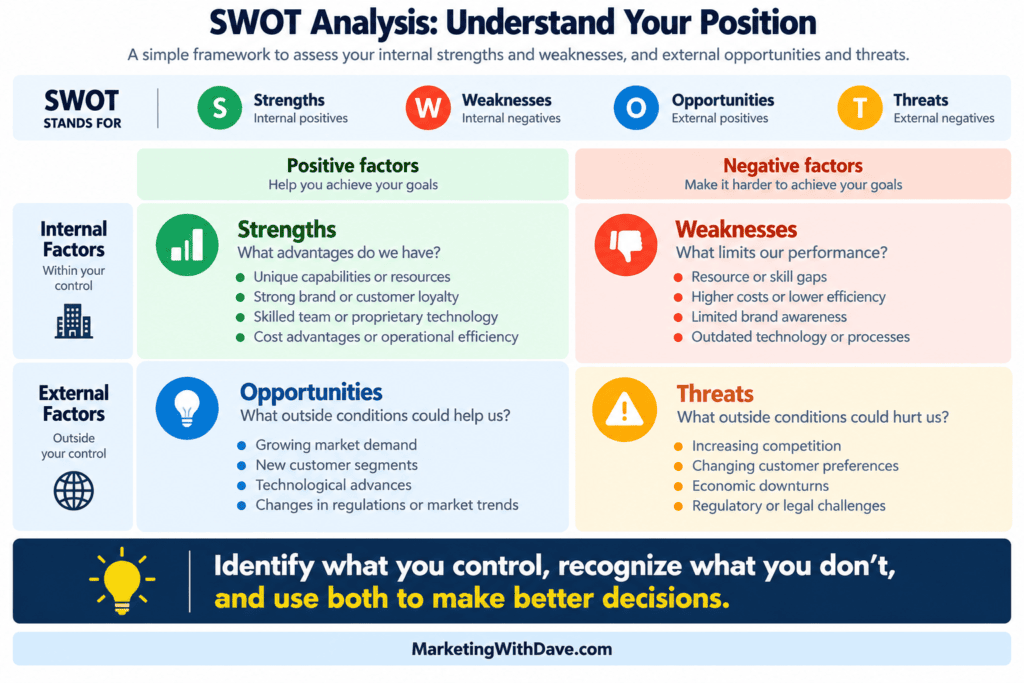
In at least one older planning outline, what we now call “threats” appeared as “problems.” Strengths and weaknesses sat on one side, problems and opportunities on the other.
That is not just semantics. “Threat” implies an external force that happens to you. “Problem” implies something you can define, scope, and solve. Language shapes agency.
I still prefer “problem.” It is harder to hide behind. It asks what exactly the issue is, what the mechanism is, and what we can do about it.
In practice, keep SWOT for shared language, but in working sessions translate threats into problem statements. “Threat: new entrant” becomes “Problem: switching costs are low and our differentiation is not legible.”
The Marketing Mix: A Backbone, Not a Box
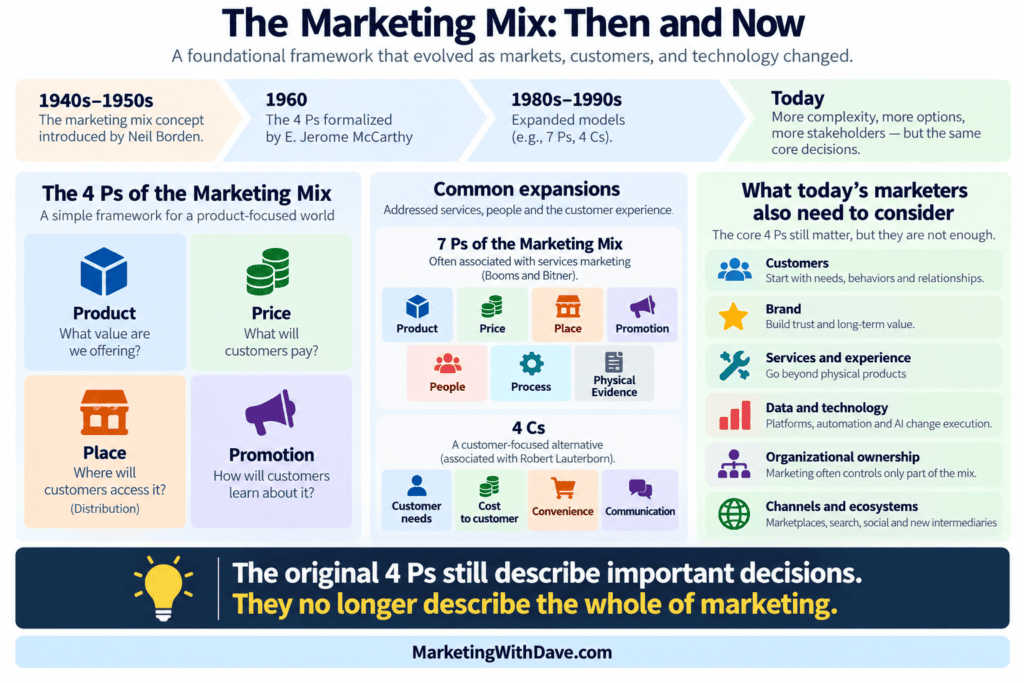
For decades, marketing textbooks were organized around the marketing mix: product, price, place, and promotion. Those four decisions remain relevant, but the framework was never a complete description of marketing. Services, customer experience, brand strategy, and organizational responsibilities extend beyond its original boundaries. The internet added new complexity: distribution can be software, promotion can be automated, and products can evolve continuously after purchase.
Later frameworks, including the 7 Ps and 4 Cs, addressed some of these gaps. I use the original Four Ps as the organizing structure for what I found in the textbook, not as a boundary around what marketing should include today.
Product: Quality, Share, and ROI
One table gave me pause. Drawn from a 1974 Harvard Business Review study by Sidney Schoeffler, Robert D. Buzzell, and Donald F. Heany, it showed the relationship between market share, product quality, and ROI. The pattern was intuitive and strong: higher share and higher quality were associated with higher returns.
Historically, many people interpreted that relationship as evidence that share and quality reinforced profitability, influencing decades of strategic thinking. The modern caution is that market share alone is not a reliable measure of competitive advantage. Niche players can be highly profitable, distribution can be controlled by platforms, and switching costs can be behavioral.
I don’t want to treat the old data as a universal law. I want to recover the question it raises: Are we building a product that creates real customer preference, and do we have a defensible way to scale it?
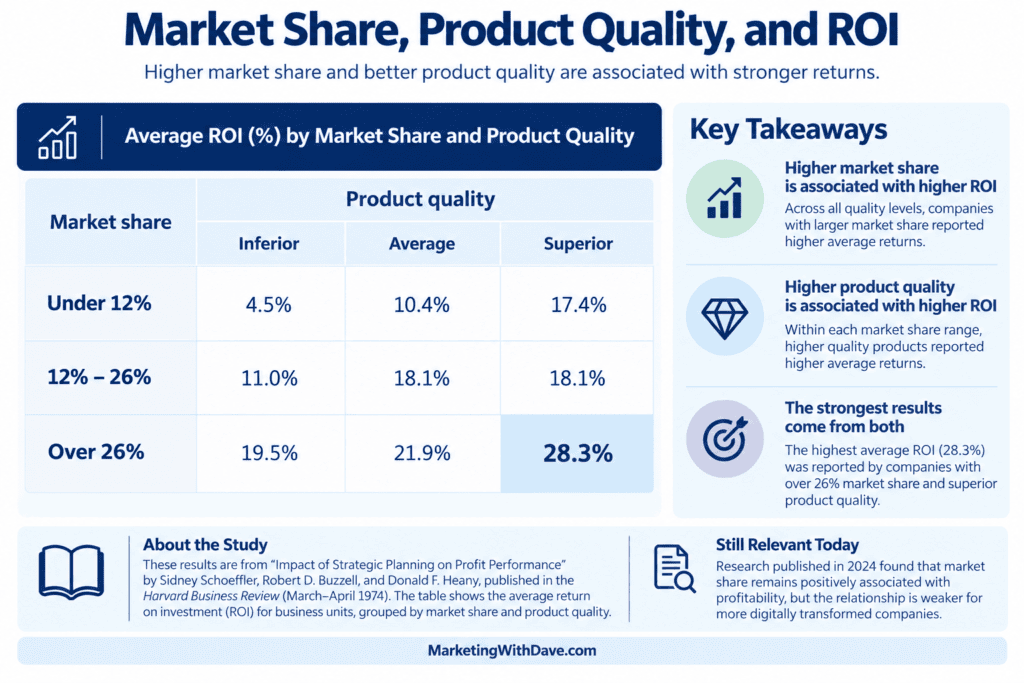
The findings came from research published in 1974, but the relationship between market share, quality, and profitability remains an active area of study. In Examining Why and When Market Share Drives Firm Profit (2022), Abhi Bhattacharya, Neil Morgan, and Lopo Rego identified market power and quality signaling as important explanations for the market share–profit relationship. A later study, Does Bigger Still Mean Better? How Digital Transformation Affects the Market Share–Profitability Relationship (2024), found that digital transformation can weaken that relationship, suggesting that market share alone is a less reliable indicator of profitability in some modern business environments. The original matrix remains a useful historical illustration, not a formula for predicting today’s returns.
The BCG Matrix Needs Guardrails
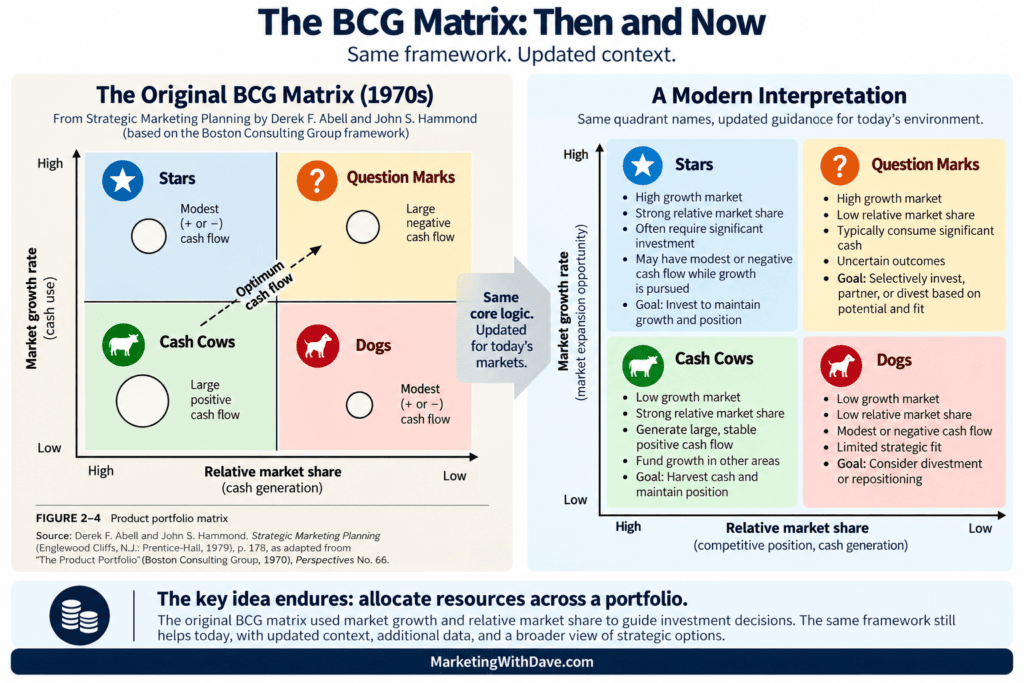
Stars, cash cows, question marks, and dogs became part of business vocabulary. The logic still works as a directional tool. It forces allocation thinking and reminds you that a portfolio needs both cash generation and growth bets.
The problem is that market share and market growth are harder to define, and many businesses have non-linear economics. Software can have very low marginal cost. Marketplaces have network effects. Creator platforms can be winner-take-most. A niche product can have high margins without share leadership.
Depending on the business model, retention, unit economics, switching friction, or share of attention may reveal more about competitive strength than relative market share alone. The important question is whether the matrix’s assumptions reflect the economics of the business you’re evaluating.
Consumer Behavior: A System, Not a Funnel
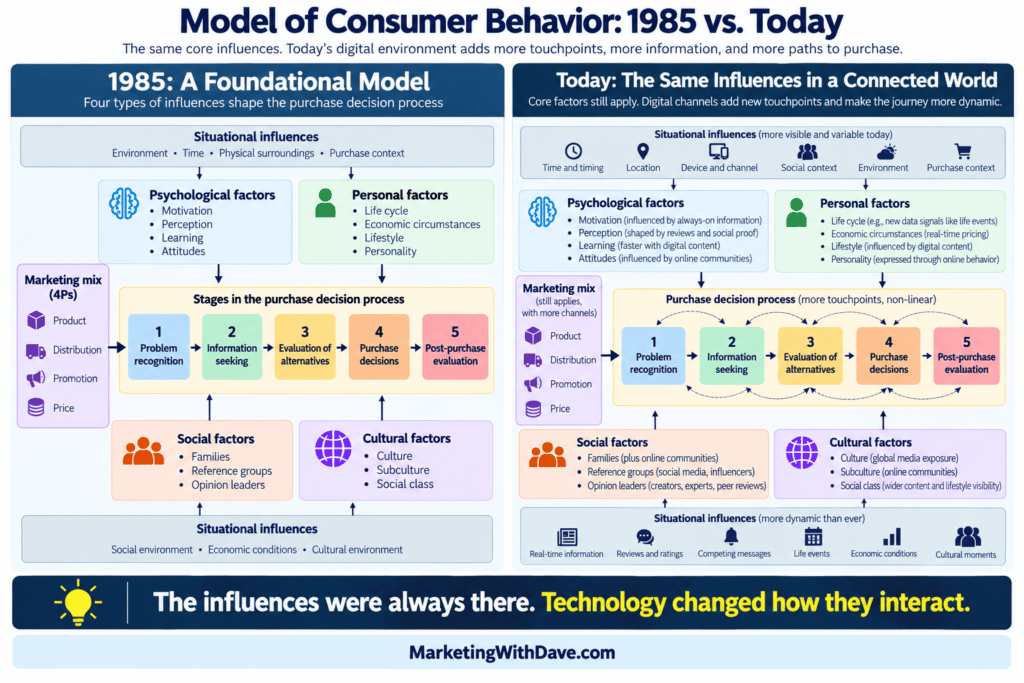
Older consumer behavior models are far more explicit than how most teams talk about journeys. Psychological, personal, social, cultural, and situational factors all feed into the stages of decision making. The premise is that buying behavior is shaped by context and learning, not just messaging.
The internet changed the information environment. Search, reviews, influencers, social proof, recommendation systems, and algorithmic feeds now shape information seeking and the evaluation of alternatives in ways older models could not anticipate. The old models still earn their place because they force four questions: what is shaping attention, trust, comprehension, and satisfaction.
Price: Constraints First, Then Strategy
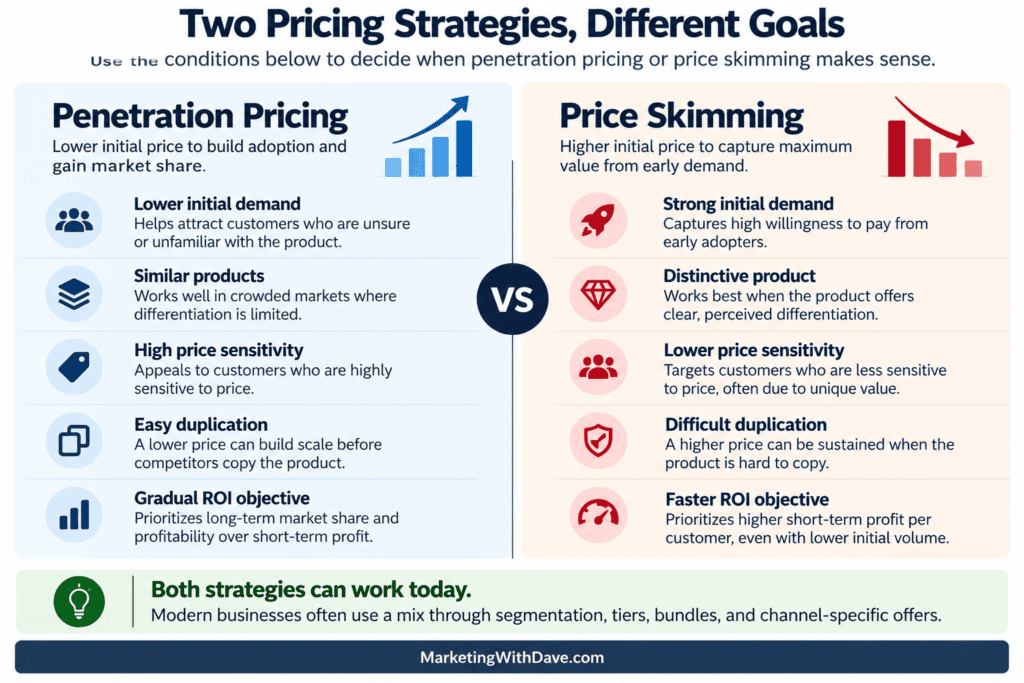
Penetration versus skimming. One figure framed these as outcomes of conditions, not preferences.
- Penetration tends to fit when desire is low, products are similar, price sensitivity is high, the product is easy to duplicate, and the ROI goal is gradual.
- Skimming tends to fit when desire is high, the product is distinctive, price is not the primary driver, duplication is not easy, and the ROI goal is fast.
The modern twist is that many businesses do both at once through segmentation, tiering, bundles, and channel-specific offers. Pricing posture can vary by audience and channel, and it can change quickly.
Floors, ceilings, and the range of discretion. A demand ceiling is the maximum price the market will tolerate. A full-cost floor is the long-term sustainable minimum. An out-of-pocket floor is the short-term survival minimum. Between ceiling and floor is the range of discretion, where strategy and positioning matter. Outside it, no pricing tactic fixes the underlying reality.
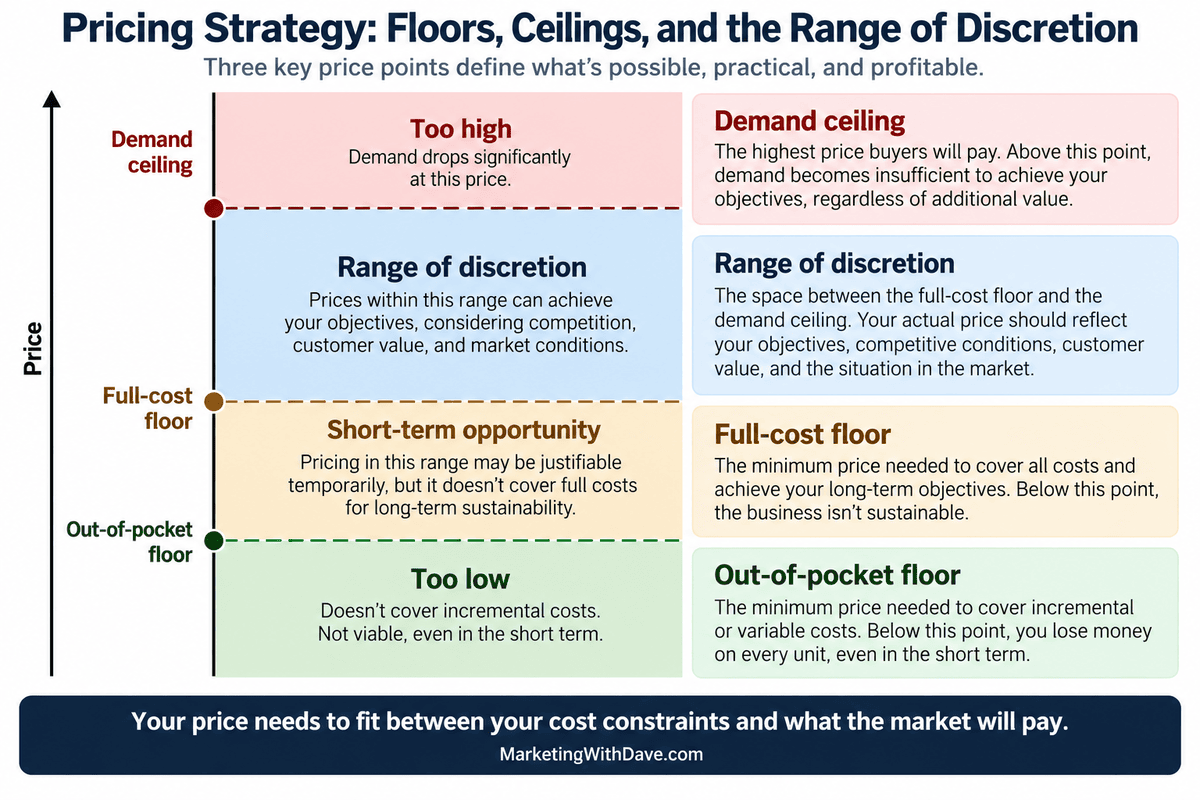
The terms may change, but the concept does not. In software, marginal cost can be near zero and pricing can be value-based, yet a floor still exists because of fixed costs and required payback. A ceiling still exists because of perceived value and alternatives.
Pricing by market share and growth. I also found a 2 by 2 for pricing options using those two axes. As a teaching tool it forces the right question: are you defending a strong position, attacking for share, harvesting short-term value, or competing in a mature, low-growth market where price pressure is real?
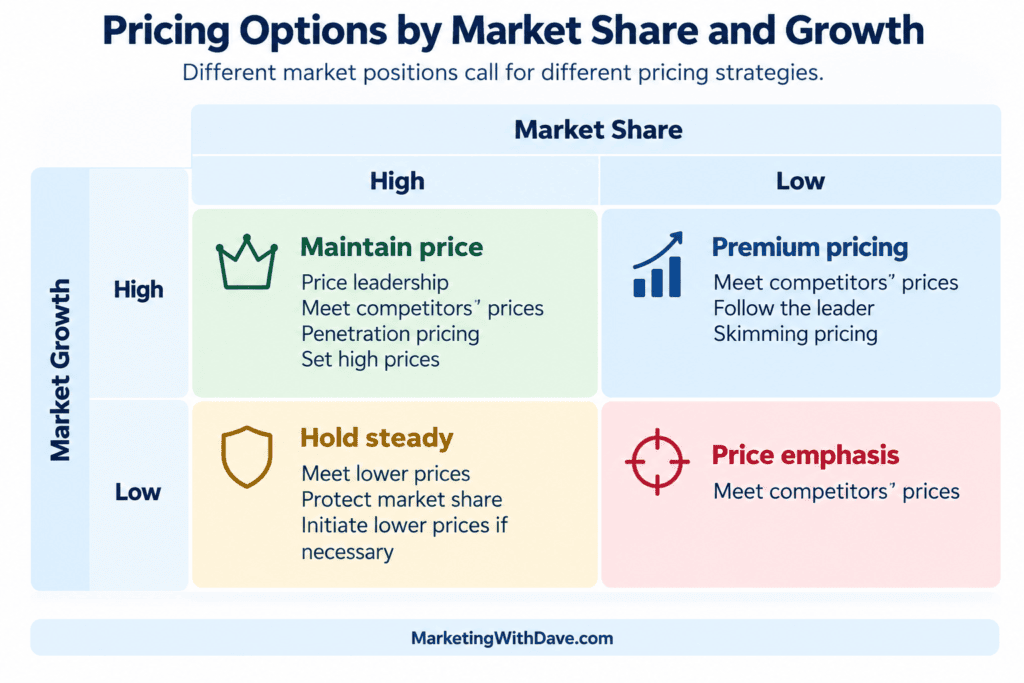
As a decision tool it is incomplete. Share is fragmented, growth is uneven by segment and channel, and the internet adds personalization, bundling, and targeted discounting. It is only valid when the market definition is stable and pricing is broadly visible. My modern update is a third dimension in the narrative: differentiation strength, or willingness to pay. Two businesses in the same quadrant can need opposite pricing decisions depending on perceived value and switching friction.
Place: Distribution Used to Be the Moat
Before the internet, access to shelves, channels, wholesalers, retailers, and sales forces shaped market structure. Distribution capacity could be a durable advantage.
Now distribution includes marketplaces, app stores, search rankings, social algorithms, email deliverability, partnerships, integrations, affiliate ecosystems, and influencer networks. That matters because many modern “promotion” decisions are really “place” decisions. If your product is not discoverable where demand forms, you can spend heavily to compensate for a distribution weakness. The old question still applies: where does demand actually get satisfied, and what constrains getting there?
Promotion: Push, Pull, and the Economics of Spend
Push versus pull. The diagram I found is refreshingly direct. Push persuades intermediaries in the channel to promote the product. Pull persuades consumers to create demand that draws the product through the channel.
Today the intermediary can be a platform, an algorithm, a creator, an affiliate, a marketplace, or an ecosystem partner. The mechanism is unchanged: who are you motivating to move the product, and where is the leverage?
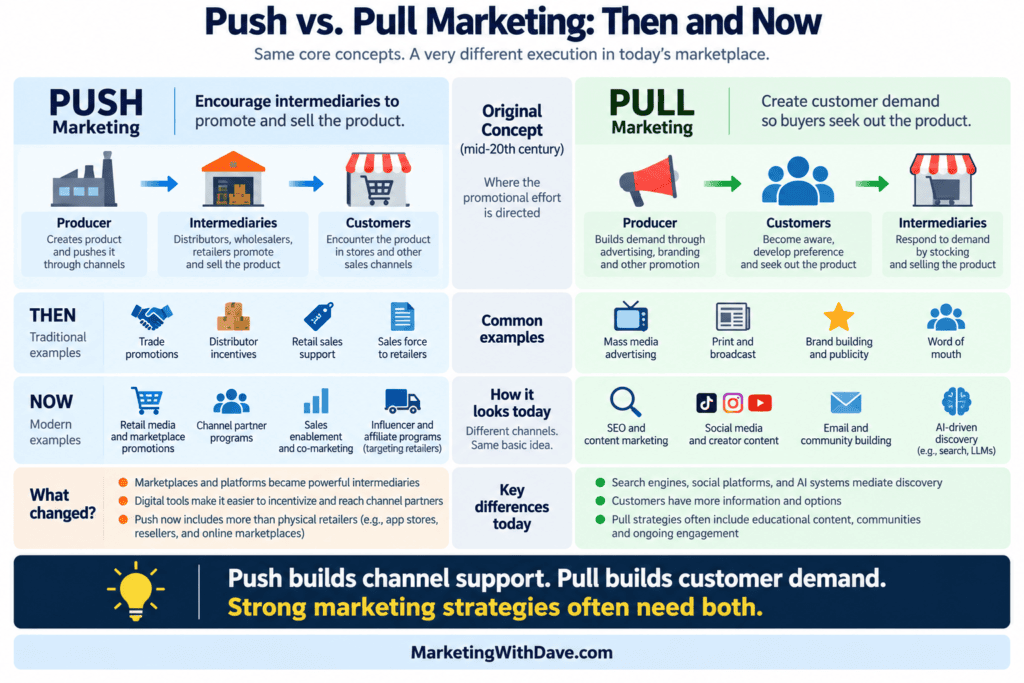
One important distinction: push and pull are strategies, not fixed labels for marketing channels. Retail media, social media, email, and paid advertising can serve different purposes depending on the audience and objective. The original distinction focused on whether promotional effort targeted intermediaries or stimulated end-customer demand. Today’s platforms often blur that line, but understanding where demand is created and who influences distribution remains essential.
Advertising share versus market share. The simple question is whether you spend more or less than your market position would suggest. Both sides are harder to measure now, since advertising is spread across fragmented channels and market share is hard to define in platform-driven markets.
A proxy-based approach can still reveal useful patterns if the assumptions and limitations are clear. Search interest may indicate brand demand, while advertising libraries can show where competitors are active, but neither directly measures advertising share. Revenue, subscribers, or usage can help approximate market position when the category is clearly defined. These are directional signals, not interchangeable metrics. The point is pattern recognition, not precision. Outliers tell stories.
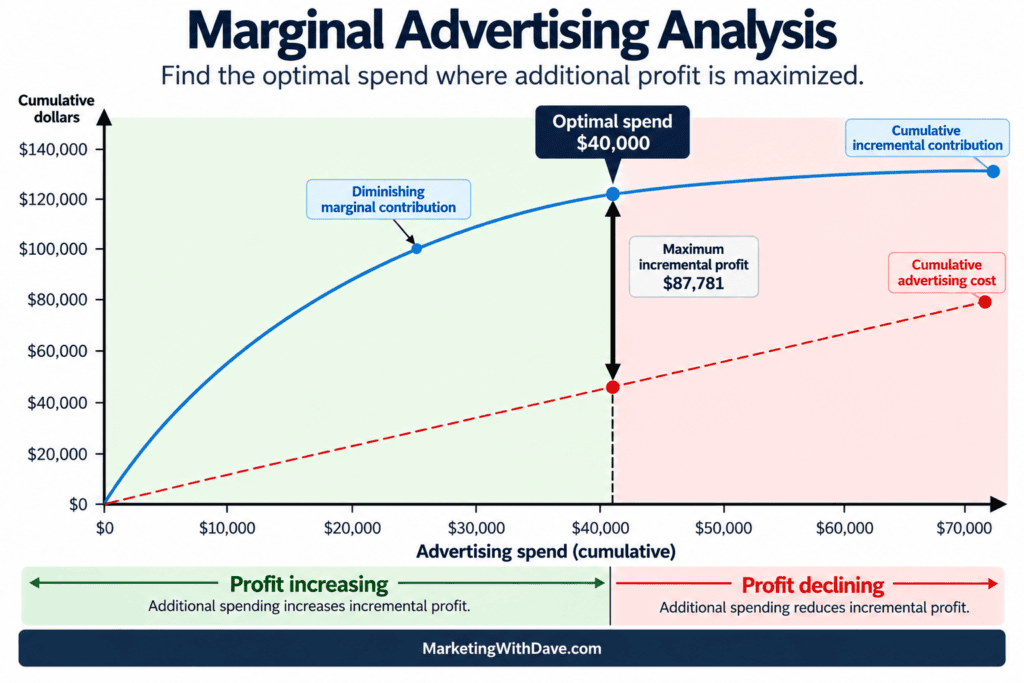
Marginal analysis and ad spend. One graph showed the short-run determination of advertising outlay by marginal analysis. The rule: keep spending until the next unit of spend no longer produces incremental profit. Modern language calls this marginal ROAS, diminishing returns curves, incrementality, and budget optimization.
The original model is elegant because it separates revenue per unit, production cost per unit, and incremental advertising cost, then locates the spending range where net profit stays positive. Its short-run focus can underweight long-run brand effects, lagged impact, and cross-channel interactions. Still, the discipline is valuable when teams confuse activity with profit.
Measurement, Information Systems, and Decisions
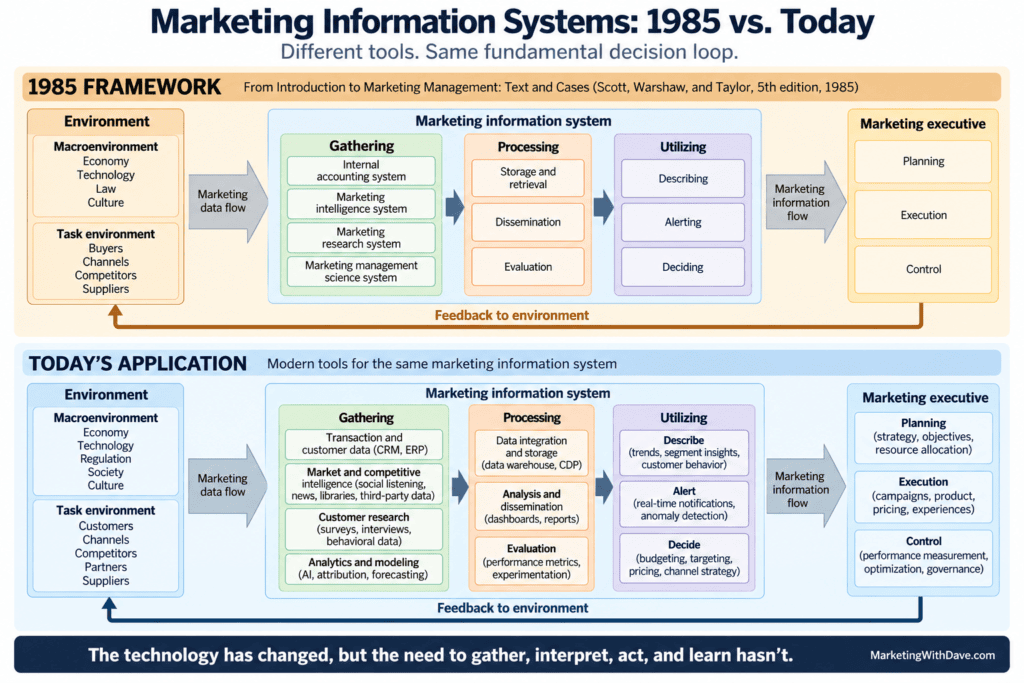
The marketing information system. One of the most important diagrams I found framed marketing as a loop. Data from the environment flows into systems for gathering, processing, and utilizing, then into planning, execution, and control, which in turn affects the environment. It is basically an early marketing operations blueprint, and it is still the right model.
Today “gathering” includes digital analytics, customer data platforms, event streams, and platform-level reporting. “Processing” includes data pipelines and governance. “Utilizing” includes experimentation, modeling, automation, and near-real-time alerts. The loop is unchanged: sense, decide, act, learn, repeat.
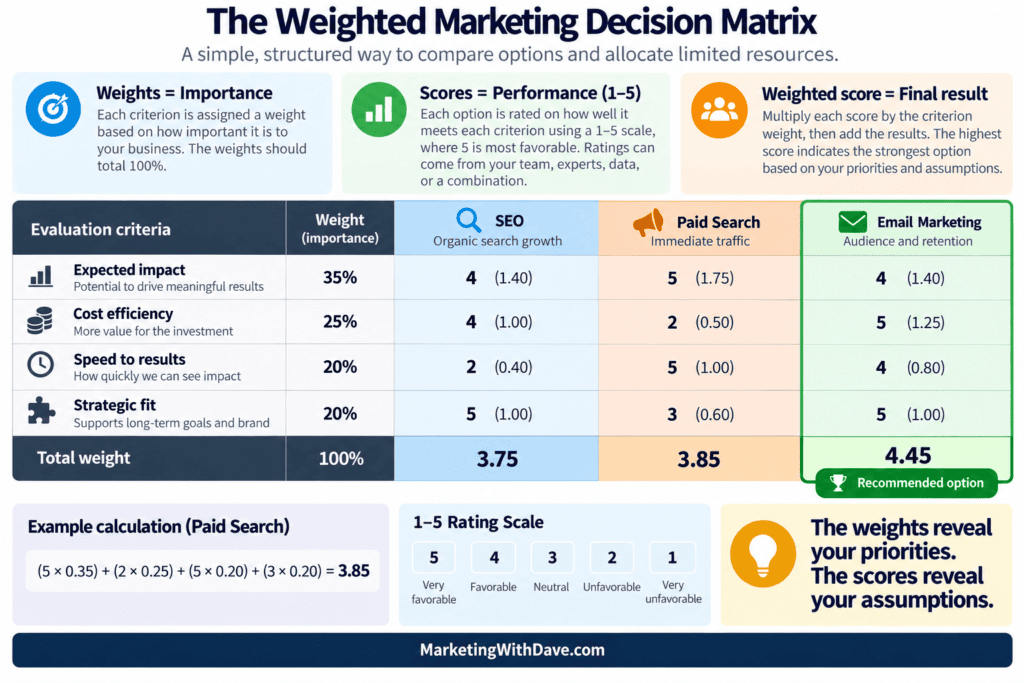
Decision matrices. I found a decision matrix for “utilization of marketing resources,” essentially a weighted scoring model across criteria like goodwill, marketing knowledge, distribution facilities, and distribution channels. Teams still do this informally in spreadsheets, vendor selection templates, partner evaluation, channel prioritization, and budget allocation.
Modern versions add criteria like data access, measurement clarity, time to impact, integration effort, compliance risk, and operating burden. The method is the same, with different constraints. It structures subjective judgment without pretending it is purely objective.
What the Internet Changed and What Remains Essential
The internet increased speed, choice, visibility, and measurability. It also changed how demand forms. Search, social, platforms, and algorithms became part of both distribution and promotion. Reviews, creators, and communities became part of product perception. Pricing became dynamic and segmented. Data became abundant, which is both empowering and distracting.
Modern marketing gained tools. It also gained ways to avoid first principles. Four habits of older thinking are worth recovering:
- Constraints before choices. Floors and ceilings before pricing debates. Situational analysis before strategy decks.
- Economics before tactics. Marginal returns before budget increases. Profit logic before channel worship.
- Language that implies agency. Problems that can be defined, not threats that just happen to you.
- Systems thinking. Marketing as a loop with feedback, not a set of disconnected activities.
Conclusion
Marketing was never simple. It was explicit. The internet made execution faster and measurement richer, and it made skipping the thinking step easier. The answer is not to reject modern marketing. It is to reconnect modern execution to older clarity.