Image alt text still matters. Writing it manually does not.
If your website has dozens or hundreds of images, opening each one individually in the Media Library is not a realistic workflow. A better approach is to export the image records you need, use AI to generate baseline alt text in bulk, review the output, and update the records back into WordPress.
This walkthrough focuses on WordPress, but the core workflow applies more broadly to any content management system that allows export, bulk processing, and structured updates. The exact tools may vary, but the process stays the same: export the right fields, generate alt text in bulk, review the results, and apply the updates cleanly.
Why image alt text still matters
One important caveat: Not every image needs descriptive alt text. Decorative images should generally use an empty alt attribute so screen readers can ignore them. The goal isn’t to fill every blank field. It’s to provide useful alt text for images that convey meaningful information.
Alt text serves two practical purposes.
Accessibility. Screen readers rely on alt text to describe images to users who cannot see them.
Image context. Search engines use image-related signals such as file names, surrounding content, and alt text to better understand what an image represents.
Alt text is not a magic search engine optimization lever by itself, but missing alt text at scale is still a quality gap worth fixing.
Why you should not be doing this manually
Most website owners and marketers do not have an alt text problem. They have a workflow problem.
The old method is to open each image, write alt text one at a time, save it, and repeat until you lose momentum. That might work for a small batch, but it does not scale when a website has years of accumulated content.
The better goal is baseline coverage at scale.
That means using AI to get from zero to good enough, then manually refining only the images that matter most, such as featured images, charts, infographics, product images, and images on high-traffic web pages.
What image fields are worth caring about
If you are exporting image-related data, keep your focus narrow. Alt text is the main field worth solving first.
ID. This makes importing or matching updates much easier and safer.
Image URL or file path. This usually contains the file name, which often gives AI enough context to generate a usable baseline alt text value.
Alt Text. This is the field you want AI to fill or improve.
Title. Optional. This can be cleaned up later, but it is lower priority than alt text.
Caption. Optional. Only useful if captions actually appear on your web pages.
Description. Usually not worth the effort unless you have a specific reason to maintain it.
If you want the simplest, highest-return workflow, export ID, image URL, and Alt Text.
What to export from WordPress
You do not need a perfect media export to make this work. In many cases, exporting the image data tied to posts or web pages is enough to create a strong first pass.
Your export should include these columns:
ID
Post title or web page title if available
Image URL
Existing Alt Text
Optional fields such as Title or Caption if you want to address them later
The key requirement is simple. Your export needs to give AI enough information to infer what each image likely is, and enough structure for WordPress to match each record during the update process.
What AI is actually doing here
This method works because many website image files already contain useful context in the file name.
For example:
digital-marketing-roundup-2026-march.jpg
becomes:
Digital marketing roundup March 2026 infographic
That is not perfect human-crafted alt text, but it is far better than leaving the field blank, and it can be generated at scale quickly.
The challenge is not generating alt text. The challenge is structuring and applying it correctly.
The practical workflow
Export the image-related records from WordPress.
Make sure the file includes ID, Image URL, and Alt Text.
Upload the CSV or spreadsheet to an AI assistant.
Ask AI to generate concise, human-readable alt text for each row based on the image URL or file name.
Review the output and flag any vague or inaccurate entries.
Update the file back into WordPress using the most reliable method available in your setup.
Spot check a sample of records after the update to confirm the changes worked.
How to make this work in WordPress without paid import plugins
In practice, importing alt text back into WordPress is where most workflows break.
After testing multiple approaches, the most reliable method is to update image alt text directly using a simple one-time script.
Step 1: Restructure your data
Your file must have one image per row:
imageurl, alttext
Step 2: Upload your CSV file
Upload the file to your Media Library and copy the file URL.
Step 3: Run a one-time update script
add_action('admin_init', function() {
    if (!current_user_can('manage_options')) return;

    $csv_url = 'YOUR_CSV_FILE_URL_HERE';
    $response = wp_remote_get($csv_url);
    if (is_wp_error($response)) return;

    $csv = wp_remote_retrieve_body($response);
    if (!$csv) return;

    $lines = preg_split('/\r\n|\r|\n/', trim($csv));
    if (!$lines || count($lines) < 2) return;

    $rows = array_map(function($line) {
        return str_getcsv($line, ',', '"', '\\');
    }, $lines);

    array_shift($rows);

    foreach ($rows as $row) {
        if (!is_array($row) || count($row) < 2) continue;

        $image_url = trim($row[0]);
        $alt_text = trim($row[1]);

        if (!$image_url || !$alt_text) continue;

        $attachment_id = attachment_url_to_postid($image_url);

        if ($attachment_id) {
            update_post_meta($attachment_id, '_wp_attachment_image_alt', $alt_text);
        }
    }
});
After running this once, disable the script.
Where this breaks down and how to avoid it
This is where you can lose hours if you get it wrong.
Multiple images in a single row Fix: Ensure one image URL per row.
Truncated image URLs Fix: Verify full paths are intact.
Import tools blocking custom fields Fix: Update directly via _wp_attachment_image_alt.
Mismatch with WordPress structure Fix: Match using image URL to attachment ID.
Over-optimizing low-impact fields Fix: Focus on alt text first.
Trying to fix everything at once Fix: Prioritize high-impact images.
Final takeaway
Image alt text is still worth having, but the solution should be more automated than manual.
Export the data, generate a baseline with AI, apply updates cleanly, and move on.
Better coverage, less friction, and a workflow you can actually repeat.
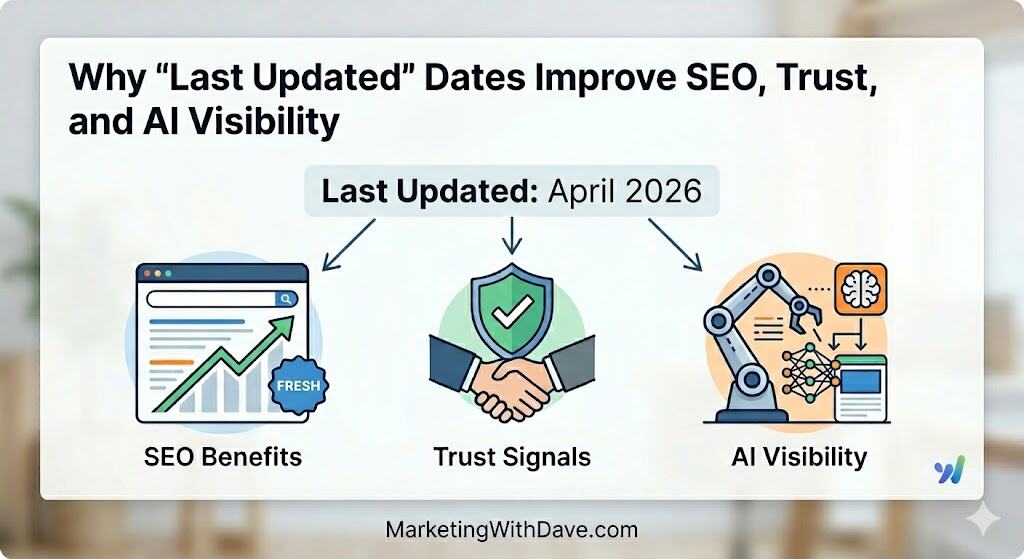
Adding a last updated date to your website content is a small change, but it can send a strong signal to readers, search engines, and AI systems. For content that covers SEO, analytics, AI, digital marketing, and other fast-changing topics, showing that a web page is actively maintained can help reduce doubt before someone even starts reading.
I resisted this idea for a long time because I do not like dating content. A publish date can make something useful look old even when the guidance is still accurate. A last updated date feels different. It does not emphasize age. It emphasizes maintenance.
Why a Last Updated Date Matters
When someone lands on a blog post, they often make a quick judgment before reading the first paragraph. They scan the title, the topic, the reading time, and any other metadata near the top of the article. If they see a clear last updated date, that helps answer an immediate question: is this still relevant?
That same signal can also help search engines and AI-driven retrieval systems better understand that your content is current enough to consider. It is not the only factor that matters, but it is a useful one, especially for topics where recency can influence trust and rankings.
Benefits of Showing a Last Updated Date
A visible last updated date can help in several ways:
It gives readers a quick trust signal that the content is being maintained.
It supports freshness signals for search engines on topics where recency matters.
It may improve the likelihood that AI systems view the content as current and relevant.
It gives you a better alternative to a publish date if you want content to feel maintained rather than aged.
It creates a natural reason to review and improve older web pages over time.
For evergreen content, that last point matters more than it might seem. Even foundational articles usually need updates over time. A framework web page may still need a revised example, a new screenshot, a better internal link, or a more current explanation. A last updated date supports that reality better than a static publish date.
Why This Can Matter for AI Visibility
As more people use AI tools to research, compare, and summarize information, signals of maintenance are becoming more important. These systems are not just evaluating relevance. They are also trying to determine which sources are current enough to trust.
In many cases, your content is not competing against one clearly better result. It is competing against several sources that are all “good enough.” When that happens, smaller signals can influence which source gets selected.
If two articles are similarly relevant, similarly structured, and cover the same topic, the one that appears more current may have an advantage. A clear last updated date does not guarantee selection, but it can help break ties.
This is not about chasing freshness for the sake of it. It is about making real maintenance visible. If you are already improving your content over time, a last updated date is one of the simplest ways to signal that.
Why I Prefer Last Updated Over Publish Date
A publish date tells readers when a piece of content first went live. Sometimes that is useful, especially for news, announcements, and time-sensitive commentary. But for many educational articles, a publish date can work against you. It may create the impression that the content is outdated, even when it has been improved several times since then.
A last updated date shifts the emphasis. Instead of saying, “this was created a long time ago,” it says, “this has been reviewed and improved.” That is a better fit for many how-to articles, resource web pages, and evergreen blog posts.
How to Add a Last Updated Date in WordPress
If your website runs on WordPress, this can usually be done automatically. WordPress already stores the modified date for posts and web pages. The main decision is whether you want to display it with a plugin, a theme setting, or a custom snippet.
One easy option is to use a code snippets plugin such as WPCode Lite. That lets you add a small PHP snippet without editing your theme files directly. It is a practical approach if you want control over the wording, placement, and formatting.
Here is the PHP snippet I used to add a “Last updated” line above the content while excluding the front page and blog index:
add_filter( 'the_content', 'mwd_add_last_updated_date' );

function mwd_add_last_updated_date( $content ) {

    // Only run on the main front-end content area
    if ( ! is_main_query() || ! in_the_loop() || is_admin() ) {
        return $content;
    }

    // Show only on single posts and regular pages
    if ( ! ( is_single() || is_page() ) ) {
        return $content;
    }

    // Exclude front page and blog posts index
    if ( is_front_page() || is_home() ) {
        return $content;
    }

    $updated_date = get_the_modified_date( 'F Y' );

    $updated_html = '<p style="font-size:13px; color:#777; margin-bottom:16px; line-height:1.4;">Last updated ' . esc_html( $updated_date ) . '</p>';

    return $updated_html . $content;
}
This version uses the modified date, formats it as month and year, and places it above the article content. Because it pulls from the modified date, it updates automatically whenever the post is meaningfully revised and saved.
Other Implementation Choices to Consider
There is more than one way to handle this, and the best approach depends on your goals. Here are a few decisions worth thinking through:
Whether to show only the last updated date or also keep the original publish date.
Whether to use a full date or just month and year.
Whether to place the date near the top of the article or farther down the web page.
Whether to style it as a quiet metadata element rather than a prominent content block.
Whether to use a plugin or a custom PHP snippet.
In my case, I preferred month and year because it feels cleaner and less rigid than a specific day stamp. I also preferred the top-of-article placement because that is where readers already expect to see metadata like category and reading time.
A Few Best Practices
If you add a last updated date, it is worth using it thoughtfully. A few simple rules can help:
Only refresh the date when you make a real improvement to the content.
Keep the format simple and easy to scan.
Make sure the styling does not compete with the title.
Use the date as a maintenance signal, not a gimmick.
Review older content periodically so the signal reflects actual work.
This is especially important if you want the date to build trust. Readers do not need to know every edit you made, but the signal should still be honest.
Final Thoughts
If you have avoided dating content because you do not want your articles to look old, a last updated date may be the better compromise. It keeps the focus on maintenance rather than age, supports trust, and may help your content stay more competitive in both search and AI-driven discovery.
It is not a magic fix, and it does not replace good content, strong internal linking, or meaningful updates. But it is one of those small changes that can quietly strengthen the way your content is perceived.
For many websites, that makes it worth considering.
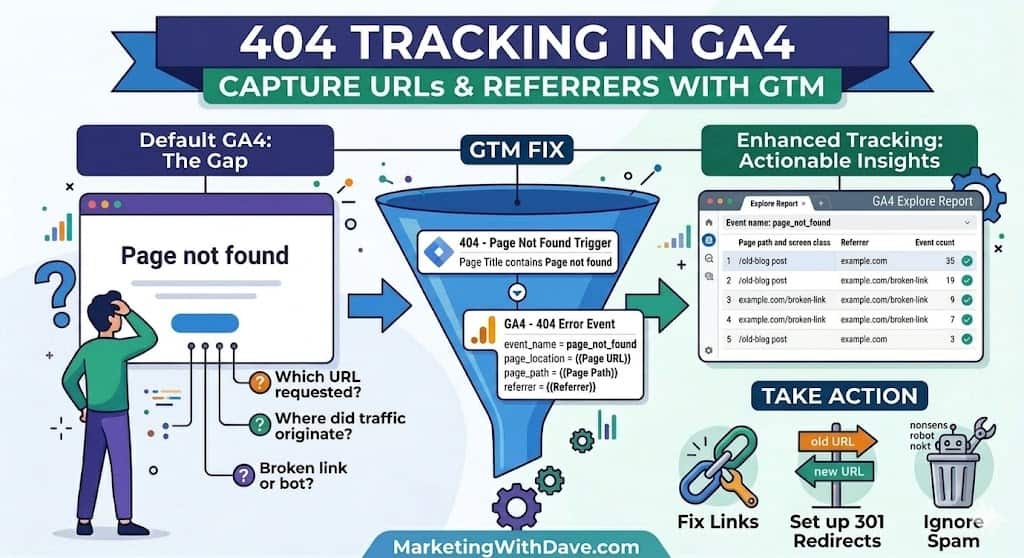
When traffic reaches a web page titled “Page not found” in Google Analytics 4, you know something went wrong, but you usually do not know much else.
Which URL was requested? Did the visitor come from your own website, another website, or bot traffic? Was it a real broken link or just noise?
That is the gap this setup solves. With a small Google Tag Manager and GA4 configuration, you can capture the attempted URL and referrer whenever a 404 web page loads. That gives you the context needed to diagnose the issue and decide what to do next.
What this setup captures
This setup sends a custom GA4 event called page_not_found whenever a 404 web page loads.
Along with the event, it sends the full attempted URL, the requested path, and the referrer. That means you can see what the visitor tried to access and where they came from.
Instead of seeing only a generic “Page not found” title in your reports, you can see the actual destination that was requested.
Why better 404 tracking matters
Some 404s are real problems. They can reveal broken internal links, outdated destinations, or incorrect external links that cost traffic and hurt user experience.
Others are just noise, such as bots requesting junk URLs that never existed.
The goal is not to treat every 404 the same. The goal is to capture enough context to know which ones deserve action.
How to set up 404 tracking in Google Tag Manager
The first step is identifying your 404 web page condition. On many WordPress websites, the browser title contains the phrase “Page not found.” If that is true on your website, you can use it as your trigger condition.
If you do not already have a Page Title variable available, create one in Google Tag Manager as a JavaScript Variable using:
document.title
Next, create a new trigger in Google Tag Manager.
Name the trigger something like:
404 - Page Not Found
Set the trigger type to:
Page View
Choose:
Some Page Views
Then use this condition:
Page Title contains Page not found
That tells GTM to fire only when a 404 web page loads.
How to send the 404 event to GA4
After the trigger is in place, create a new GA4 Event tag in Google Tag Manager.
Name it something like:
GA4 - 404 Error
Use your existing GA4 configuration tag.
Set the event name to:
page_not_found
Then add these event parameters:
page_location = {{Page URL}}
page_path = {{Page Path}}
referrer = {{Referrer}}
Attach the 404 - Page Not Found trigger to the tag and publish the container.
At that point, GA4 will start receiving a dedicated 404 event with enough context to investigate what happened.
How to build the GA4 report
The easiest long-term approach is to build an Explore report in GA4 focused only on the page_not_found event.
Go to Explore and create a Free Form exploration.
Add these dimensions:
Event name
Page path and screen class
Add this metric:
Event count
Then apply a filter where:
Event name exactly matches page_not_found
This gives you a simple report showing which broken URLs are being requested most often.
Once data is flowing, add referrer-related dimensions if they are available in your property.
How to interpret the data
Once 404 tracking is live, the next step is deciding what kind of problem each broken URL represents.
If you see a clean-looking path that resembles a real article, category, or resource, that is often a legitimate issue. It may be an outdated internal link, a changed URL, or an old destination that still receives traffic.
If you see a bad path with an external referrer, that usually points to an incorrect backlink. In many cases, a redirect is the right fix.
If you see bizarre paths that never looked like real website content, especially with no meaningful referrer, that is often just spam or automated scanning. In those cases, the right action may simply be to ignore it.
What action you can take from this data
The value of better 404 tracking is that it gives you a short list of decisions instead of a vague warning.
If the broken URL is caused by a bad internal link, fix the source link.
If the URL used to exist and still gets meaningful traffic, consider a 301 redirect.
If the request comes from another website, decide whether the traffic is worth recovering with a redirect.
If the path is obvious junk, treat it as noise and move on.
Why this setup is worth it
Out of the box, GA4 can tell you that a 404 happened. This setup tells you what was requested and where it came from.
That makes it easier to fix broken internal links, recover traffic with redirects, and ignore junk requests that do not matter.
It is a small implementation, but it turns vague 404 reporting into something you can actually use.
Why it matters: Conversational interfaces are evolving into both media channels and commerce entry points.
Implications:
Marketers: Treat ChatGPT as both a discovery layer and emerging paid channel.
Startup operators: Ensure products are structured for comparison and selection inside AI interfaces.
Researchers: Monitor shifts in product discovery away from traditional search web pages.
2. Google extended retail media into YouTube with closed-loop measurement
What happened: Google expanded its Commerce Media Suite, enabling advertisers to use retailer data like Kroger audiences across YouTube and DV360, with SKU-level attribution.
Why it matters: Retail media is moving beyond retailer-owned environments into full-funnel media ecosystems.
Implications:
Marketers: Can connect upper-funnel media spend directly to retail outcomes.
Investors: Retail media is solidifying as core advertising infrastructure.
Researchers: Closed-loop measurement is becoming central to budget allocation.
3. Google embedded AI advisors into core ads and analytics workflows
What happened: Google advanced Ads Advisor and Analytics Advisor, enabling natural-language analysis, campaign diagnosis, and direct optimization support within its platforms.
Why it matters: AI is shifting from feature-level assistance to integrated workflow support inside core marketing systems.
Implications:
Marketers: Faster analysis and execution cycles reduce friction between insight and action.
Startup operators: Platform-native AI increases pressure on standalone martech tools.
Researchers: Expect changes in analyst productivity and tool consolidation.
4. Meta expanded advertiser verification requirements
What happened: Meta increased enforcement of advertiser verification, targeting a shift where verified advertisers will represent the majority of ad revenue.
Why it matters: Apple is opening another owned surface to advertising and competing in local intent.
Implications:
Marketers: Prepare for a new local discovery channel.
Investors: Reinforces Apple’s expansion in services revenue.
Policymakers: Raises questions around privacy positioning versus ad growth.
9. Structural shift: decision layers are replacing traditional discovery channels
What happened: Across platforms, discovery is increasingly happening inside AI systems, retail media networks, and platform-owned environments rather than open web browsing.
Why it matters: Platform power is concentrating around systems that shape decisions earlier in the customer journey.
Implications:
Marketers: Optimize for inclusion in recommendation and comparison systems, not just traffic acquisition.
Startup operators: Distribution depends on visibility inside decision layers.
Researchers: Focus on convergence across AI, commerce, and media ecosystems.
10. Google released the March 2026 core update
What happened: Google rolled out its March 2026 core update, a broad recalibration of ranking systems that changed how content quality, relevance, and authority are evaluated across search results. The rollout occurred over roughly two weeks and caused widespread ranking volatility.
Why it matters: Core updates reprice organic visibility at scale, shifting traffic across entire web pages based on updated quality and intent signals.
Implications:
Marketers: Content performance is increasingly driven by alignment to search intent, depth, and trust signals rather than keyword targeting alone.
Marketers: AI-generated and low-value content is more likely to lose visibility if it lacks originality, expertise, or clear user value.
Researchers: Ranking shifts reflect a system-wide re-evaluation of content quality rather than penalties, making outcomes harder to attribute to single factors.
Attribution models influence how marketers allocate budget, but most teams misunderstand what they are actually showing. Strategic frameworks such as the PERO media type model can help marketers balance paid, earned, rented, and owned media investments.
If you give too much credit to the wrong channel, you will eventually over invest in the wrong tactic. If you under-credit upper funnel work, you may starve the channels that create future demand. If you over-credit last click, you may convince yourself that bottom funnel activity is carrying the whole business when it is really just harvesting demand created elsewhere.
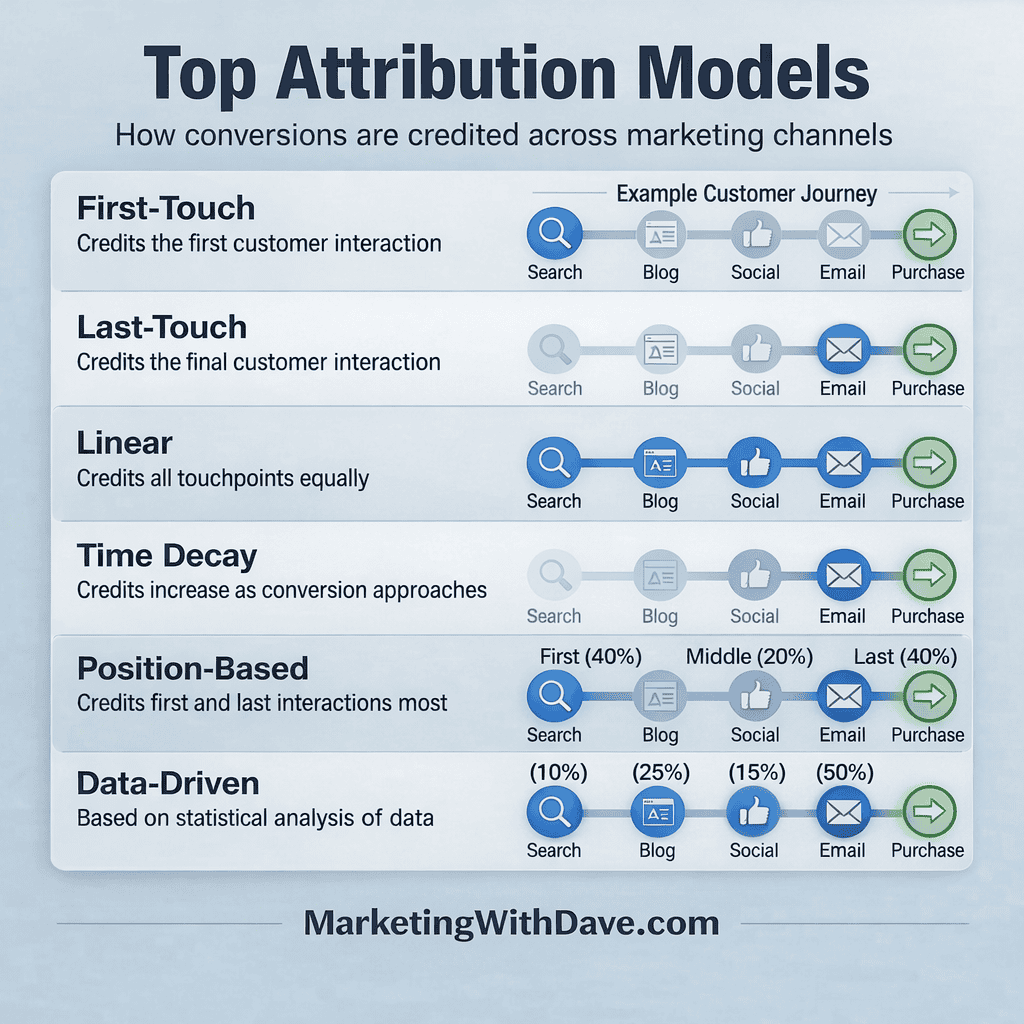
The visual below compares six of the most common attribution models and shows how credit shifts across a simple customer journey from Search to Blog to Social to Email to Purchase.
Why attribution models matter more than most marketers realize
Most marketers do not have a measurement problem as much as they have an interpretation problem. The dashboard may be working. The tags may be firing. The reports may be populating. But if the organization does not understand how conversion credit is being assigned, decisions quickly drift away from reality.
This is where attribution models become useful. They are not perfect mirrors of truth. They are frameworks for understanding how different touchpoints may have contributed to a result. Each model tells a different story, and each one can be useful in the right context.
Each attribution model answers a different question:
First-touch answers: What introduced the customer to us?
Last-touch answers: What closed the deal?
Linear answers: What supported the full journey?
Time decay answers: What mattered most as the decision approached?
Position-based answers: What started and finished the journey?
Data-driven answers: What actually influenced conversion based on observed behavior?
This is the key idea. There is no single “best” attribution model. The right model depends on the decision you are trying to make.
Quick summary of attribution models
First-touch: Best for understanding awareness. Weak at measuring conversion influence.
Last-touch: Best for measuring closing channels. Ignores earlier interactions.
Linear: Best for balanced visibility. Assumes all touchpoints are equal.
Time decay: Best for short or momentum-driven journeys. Undervalues early discovery.
Position-based: Best for balancing discovery and conversion. Still simplified weighting.
Data-driven: Best for advanced analysis with strong data. Depends heavily on data quality.
The six common attribution models in this graphic
1. First-Touch Attribution
First-touch attribution gives all credit to the first marketing interaction. In the example journey, Search gets the credit.
This model is useful when your main question is: What introduced the customer to us? It can be helpful for brand awareness analysis, top-of-funnel campaigns, and lead source reporting.
The weakness is obvious. It ignores everything that happened after that first interaction. That means it can overvalue discovery and undervalue nurturing, retargeting, and conversion support.
2. Last-Touch Attribution
Last-touch attribution gives all credit to the final marketing interaction before conversion. In the graphic, Email receives the credit.
This model is popular because it is simple. It often lines up with how businesses think about closing activity, especially in lead generation, ecommerce promotions, and email-heavy funnels.
The problem is that last-touch can make closing channels look stronger than they really are. A customer may have first discovered your brand through search, learned from a blog post, seen social proof, and only then clicked an email. If email gets all the credit, the rest of the journey disappears.
3. Linear Attribution
Linear attribution spreads credit evenly across the marketing touchpoints in the journey. Search, Blog, Social, and Email all share credit equally.
This model is useful when you want to acknowledge that multiple touches mattered and do not want to overemphasize either discovery or closing.
Its limitation is that not every touchpoint actually contributes equally. A quick social impression and a high-intent email click may not deserve the same value, even if linear attribution says they do.
4. Time Decay Attribution
Time decay attribution gives more credit to interactions closer to conversion. Earlier touches still matter, but later touches receive more weight.
This model is often useful in longer consideration cycles where momentum builds over time. It can make sense when later interactions truly do play a stronger role in helping the customer decide.
The caution here is that time decay can still undervalue the channels that created awareness and initial interest, especially when those channels are doing the hard work of entering the buyer into the journey.
5. Position-Based Attribution
Position-based attribution, often called the 40-20-40 model, gives substantial credit to the first and last interactions, then spreads the remaining credit across the middle touches.
In practice, this model reflects a common marketing reality. The first touch often matters because it created the opportunity. The last touch often matters because it helped close the action. The middle touches still matter, but usually as support rather than the primary driver.
For many teams, this is one of the most intuitive models because it balances discovery and conversion without pretending the journey was evenly weighted.
6. Data-Driven Attribution
Data-driven attribution uses observed conversion patterns to assign credit based on statistical contribution. In the image, Search receives 10%, Blog 25%, Social 15%, and Email 50%.
This is usually the most sophisticated option because it does not force every journey into a rigid formula. Instead, it attempts to learn from actual path behavior.
That said, data-driven attribution is only as useful as the quality of your measurement foundation. If your tracking is weak, your consent setup is inconsistent, your conversion definitions are muddy, or your traffic mix is noisy, the model can still produce misleading confidence.
The six models above are the most recognizable attribution frameworks, but they are not the only useful ways to think about marketing allocation.
Custom Weighted Attribution
Some organizations create their own weighting logic based on business knowledge, sales cycle length, funnel maturity, or product type. This can be useful when standard models do not reflect how the business really grows. The danger is that custom models can become political if they are built to justify existing budget choices instead of reveal reality.
Incrementality Testing
Incrementality asks a different question: what would have happened if this channel or campaign had not run at all? This is often more useful than attribution when you are trying to understand whether a channel created lift versus merely captured existing demand.
In other words, attribution distributes credit. Incrementality challenges whether the credit should exist in the first place.
Media Mix Modeling
Media mix modeling looks at broader patterns across time and tries to estimate the contribution of channels using aggregate data rather than user-level paths. This is especially relevant in privacy-constrained environments where user-level tracking is less complete than it used to be.
For larger brands, media mix modeling can help answer strategic budget questions that click-path attribution alone cannot answer well.
Marginal ROI and Saturation Analysis
One of the most useful allocation frameworks is not really an attribution model at all. It is the study of what happens as you invest more into a channel. The next dollar does not always perform like the last dollar. Every experienced marketer eventually learns this.
A channel can look amazing in attribution reports and still be at or near saturation. That is why budget allocation should never depend only on credited conversions. It should also consider diminishing returns.
How to actually use attribution models (not just understand them)
Most marketers make the same mistake. They pick one attribution model and treat it as truth.
The better approach is to compare models side by side.
Use first-touch to understand what creates demand. Use last-touch to understand what captures it. Use a balanced or data-driven model to evaluate how the journey works as a whole.
The insight comes from the differences between models, not from any single model by itself.
Attribution models are useful, but they are not truth machines. Each framework highlights different parts of the customer journey and introduces its own bias. Understanding those biases is what allows marketers to interpret the data correctly and make better allocation decisions.
Here is the kind of practical guidance that tends to matter most.
1. Never trust a single attribution view by itself.
Look at first-touch, last-touch, and a more balanced model side by side. If one channel only looks strong in one framework and weak in the others, that is worth investigating.
2. Separate demand creation from demand capture.
Branded search, email, direct traffic, and remarketing often look great because they are close to conversion. That does not mean they created the original demand.
3. Watch for channel cannibalization.
Sometimes a channel does not create incremental lift. It simply intercepts conversions that would have happened anyway. This is especially common in branded paid search, retargeting, and aggressive promo email programs.
4. Audit your conversion definitions.
Bad conversion design creates bad allocation decisions. If every micro-action is treated like a win, attribution reports can look impressive while actual business outcomes stay flat.
5. Do not confuse measurability with importance.
The easiest channels to track are not always the most important channels in the journey. Upper-funnel content, social influence, PR, word of mouth, and offline impact can be undercounted while measurable lower-funnel clicks get overpraised.
6. Budget decisions should consider volume, efficiency, and strategic role.
A channel may have a higher CPA but still deserve investment if it expands reach, builds future demand, or improves the whole funnel.
What is changing in the AI marketing world right now
AI is changing attribution and allocation in two important ways at the same time.
First, platforms are using more automation to decide targeting, creative matching, bidding, and optimization.
Second, marketers are being pushed to rely more on modeled and inferred performance rather than clean, user-level certainty.
That shift creates both opportunity and risk.
AI is helping platforms find more demand
Search and paid social platforms are increasingly leaning into AI-assisted campaign expansion, creative generation, and automated optimization. That means marketers can often unlock more reach and more combinations than a fully manual setup would have captured.
But the tradeoff is that the system becomes harder to inspect. You may get stronger performance while simultaneously having less obvious visibility into exactly why the performance improved.
Creative and landing page quality matter even more
As targeting and bidding become more automated, creative quality, message clarity, offer strength, and landing page experience become bigger levers. If the machine can distribute faster than before, weak inputs get exposed faster too.
That means allocation is no longer just about where you spend. It is also about what you feed the machine.
Modeled measurement is becoming normal
Privacy changes, consent requirements, and reduced user-level signal mean more reporting is influenced by modeled behavior. That does not make the data useless. It just means marketers need to stop pretending every decimal point is ground truth.
The practical answer is not to reject modeling. It is to validate performance from multiple angles: platform reports, analytics, CRM outcomes, controlled tests, and business results.
AI makes disciplined testing more important, not less
When platforms automate more of the delivery, marketers still need a way to verify whether outcomes are truly improving. That is why holdout tests, lift analysis, creative testing, and business-level validation matter so much. If you skip those steps, it becomes easy to mistake machine confidence for business truth.
What to look out for when using attribution for budget decisions
If you are using attribution data to guide marketing allocation, watch for these traps.
Over-crediting bottom funnel channels because they show up closest to conversion.
Under-crediting awareness channels because they do not close the sale directly.
Letting platform-reported results outrun CRM or revenue reality.
Assuming a channel is incremental when it may simply be intercepting existing demand.
Expanding budget into a channel that looks efficient only because it is still small.
Treating AI-generated recommendations as strategy instead of input.
A more mature way to think about marketing allocation
The best marketers do not ask, “Which attribution model is right?” They ask, “What decision am I trying to make, and which framework helps me make it with the least distortion?”
If you are trying to understand discovery, first-touch may help. If you are evaluating closing influence, last-touch may help. If you want a balanced directional view, position-based may help. If you have strong enough data and enough volume, data-driven may help. If you need to know whether a channel creates real lift, attribution alone is not enough and testing becomes essential.
That is the deeper lesson. Attribution is not the finish line. It is a lens. Use the lens that best fits the decision, then validate the result against actual business performance.
Final takeaway
Marketing allocation gets messy when teams expect one dashboard, one platform, or one attribution model to explain everything. Real customer journeys are more complex than that. They are multi-touch, uneven, and often partially hidden.
The goal is not perfect certainty. The goal is better decisions.
If you understand what each attribution framework emphasizes, what it ignores, and how it may bias your budget conversations, you are already ahead of most marketers.
And in an AI-shaped marketing world, that judgment matters even more than the model itself.
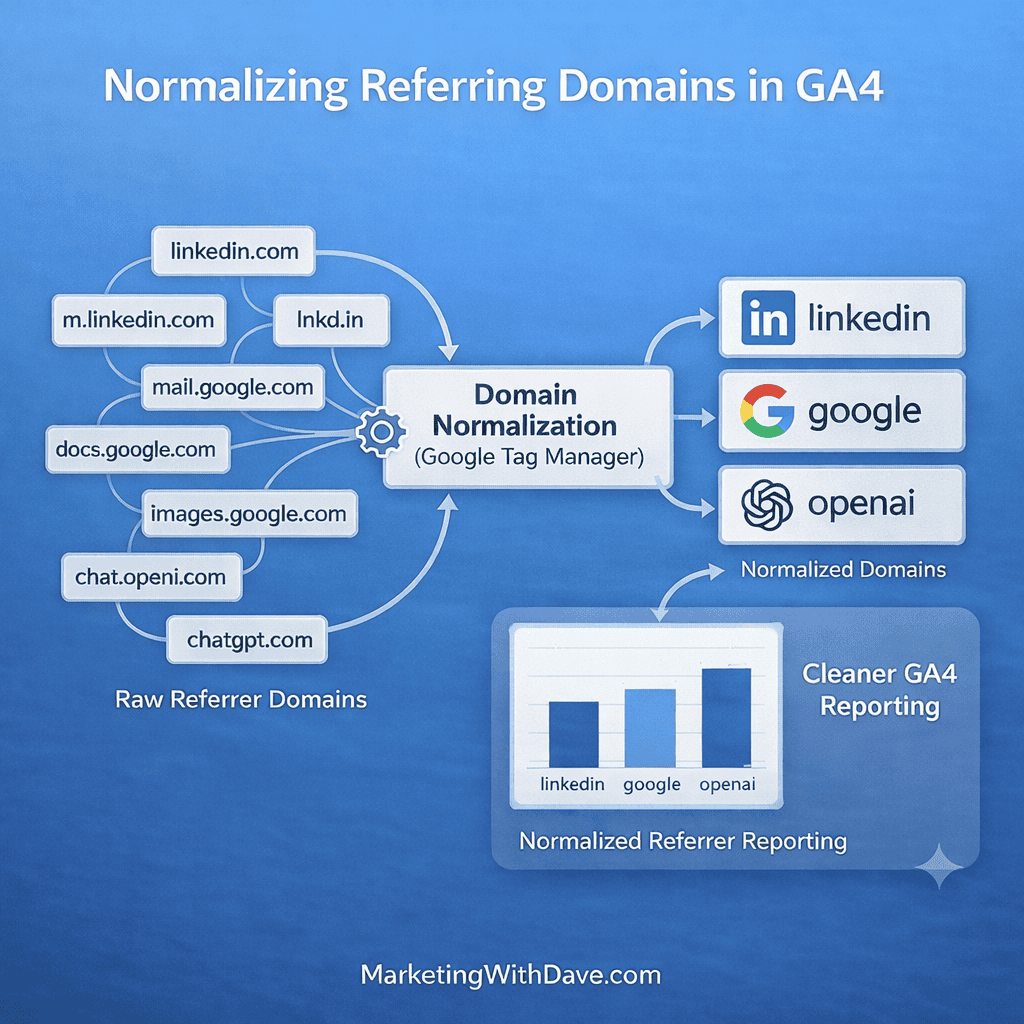
Google Analytics (GA4) provides useful traffic source reporting, but referring domain data can quickly become messy. The same platform may appear in multiple forms such as linkedin.com, www.linkedin.com, or lnkd.in. Google referrals may appear as google.com, mail.google.com, or docs.google.com.
When these variations are not cleaned up, referral reporting becomes fragmented. Instead of clearly seeing which platforms drive traffic, analytics reports fill up with dozens or even hundreds of inconsistent domains.
This article explains how to categorize referring domain traffic in GA4 using Google Tag Manager. The approach normalizes messy referrer values and assigns them to clear traffic categories such as social platforms, search engines, internal traffic, AI tools, or spam domains.
The result is much cleaner referral reporting and a much easier way to analyze where your traffic actually comes from.
The Problem With Referring Domain Data in GA4
Referring domains represent the website that sent a visitor to your website. In theory this sounds simple, but in practice the data can become messy very quickly.
One platform may appear under multiple domain variations. Mobile apps, redirect services, and shortened links can all generate slightly different referrer values. The result is fragmented reporting that makes it harder to compare traffic sources over time.
For example, LinkedIn traffic may appear under several variations.
linkedin.com
www.linkedin.com
lnkd.in
Each variation appears as a separate referrer in GA4, even though they all represent the same platform.
The same issue appears across many other platforms including Google, Pinterest, Medium, and social networks.
Normalization and Categorization Explained
This solution uses two related steps.
First, referring domains are normalized. This means multiple domain variations are cleaned into a single consistent value.
Second, those normalized values are categorized into meaningful traffic groups.
The workflow looks like this.
Raw referrer
→ Normalized domain
→ Traffic category
For example.
lnkd.in
→ linkedin
→ social
mail.google.com
→ google
→ search
marketingwithdave.com
→ internal
→ internal
startraffic.online
→ spam
→ spam
This process dramatically simplifies referral reporting.
Why Categorizing Referrers Is Valuable
GA4 already identifies traffic channels such as Organic Search, Social, and Referral. However, those channels do not always show which specific platform generated the visit.
Categorized referring domains allow you to see traffic at a much more meaningful level.
Instead of only seeing social traffic, you can more clearly separate traffic from platforms such as LinkedIn, Instagram, Pinterest, or X.
This is especially helpful if you promote content across multiple platforms and want to measure which ones actually drive visits.
It also allows you to quickly separate legitimate traffic from spam referrals or internal visits.
Categories Worth Tracking
A good first implementation should classify several common types of traffic.
Search engines such as Google, Bing, DuckDuckGo, and others.
Social platforms such as LinkedIn, Instagram, Pinterest, TikTok, Medium, Reddit, and X.
AI tools such as ChatGPT, Claude, and Perplexity. These platforms are increasingly appearing in referral data as AI assistants begin linking directly to websites.
Internal traffic coming from your own domain.
Spam domains that generate junk referrals.
Any domain not yet reviewed should fall into a category called not-classified. This makes it easier to identify domains that need to be reviewed later.
When This Approach Is Especially Useful
This setup is particularly helpful if you publish content regularly across multiple platforms.
It is also valuable if you want to identify AI-generated traffic, remove spam domains from reports, or clearly separate internal traffic from real visitors.
If you build dashboards in Looker Studio or export traffic data to spreadsheets, normalized referrer categories make analysis much easier.
Creating the Referrer Normalization Variable in GTM
The normalization logic is implemented using a Custom JavaScript variable in Google Tag Manager.
Create a new variable using the Custom JavaScript variable type and paste the following script.
function() {
  var ref = document.referrer;

  if (!ref) return 'direct';

  var host = '';
  try {
    host = new URL(ref).hostname.toLowerCase();
  } catch (e) {
    return 'not-classified';
  }

  host = host.replace(/^www\./, '');

  if (host.indexOf('marketingwithdave.com') > -1) return 'internal';

  if (host.indexOf('google.') > -1) return 'google';
  if (host.indexOf('bing.com') > -1) return 'bing';
  if (host.indexOf('duckduckgo.com') > -1) return 'duckduckgo';

  if (host.indexOf('linkedin.com') > -1 || host.indexOf('lnkd.in') > -1) return 'linkedin';
  if (host.indexOf('facebook.com') > -1) return 'facebook';
  if (host.indexOf('instagram.com') > -1) return 'instagram';
  if (host.indexOf('pinterest.com') > -1 || host.indexOf('pin.it') > -1) return 'pinterest';
  if (host.indexOf('tiktok.com') > -1) return 'tiktok';
  if (host.indexOf('medium.com') > -1) return 'medium';
  if (host === 't.co' || host.indexOf('twitter.com') > -1 || host === 'x.com') return 'x-twitter';

  if (host.indexOf('chatgpt.com') > -1 || host.indexOf('chat.openai.com') > -1) return 'chatgpt';
  if (host.indexOf('claude.ai') > -1) return 'claude';
  if (host.indexOf('perplexity.ai') > -1) return 'perplexity';

  if (host.indexOf('startraffic.online') > -1) return 'spam';

  return 'not-classified';
}
Name the variable something descriptive such as JS – Referrer Normalized.
Adding the Variable to Your GA4 Tag
Open your GA4 Google Tag or page_view tag in Google Tag Manager.
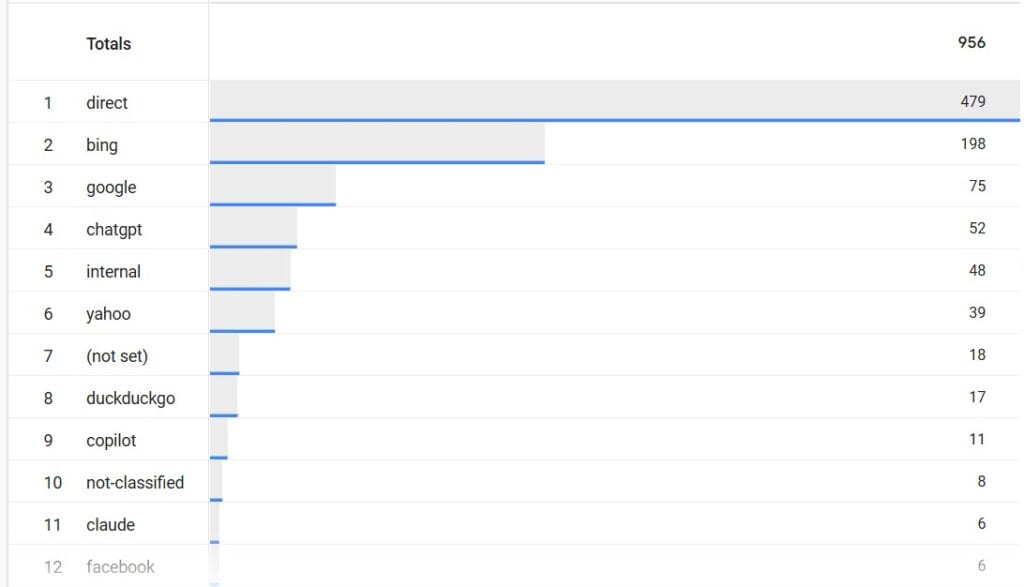
Add a configuration parameter with the following values.
This allows the normalized value to appear in GA4 reports and explorations.
Important GA4 Limitation
GA4 custom dimensions are not retroactive. Historical referral data will not be reprocessed.
The categorized values will only appear for traffic collected after the implementation goes live.
Expanding the Classification Over Time
Your first version does not need to classify every possible domain.
Start with the platforms you already know are important. Over time, review domains that appear under not-classified and add additional rules as needed.
This gradual approach allows the classification system to evolve alongside your traffic patterns.
Visualizing the Workflow
A simple diagram can help illustrate the process.
Raw Referrer
→ Normalized Domain
→ Traffic Category
This visual representation works well as a blog image and helps readers quickly understand how the transformation occurs.
Final Thoughts
Referring domain data in GA4 often becomes fragmented and difficult to analyze. Normalizing and categorizing referrer values provides a simple way to transform messy domain data into clear traffic insights.
With a small amount of logic in Google Tag Manager, referral traffic can be organized into meaningful categories that are much easier to analyze in GA4 dashboards and reports.
If you regularly share content across multiple platforms or want to better understand where your visitors originate, categorizing referring domain traffic is one of the most useful analytics improvements you can implement.