visby llm traffic sources 1

Visby Review: AI Search Visibility and GEO Monitoring Tool

Reading Time: 6 minutes

AI tools are already influencing how people discover brands, but most marketers still cannot see whether they are being recommended or ignored.

Visby helps make that visible. It tracks how your brand appears across AI assistants like ChatGPT, Claude, and Gemini, shows which competitors are winning visibility, and turns those insights into prioritized action.
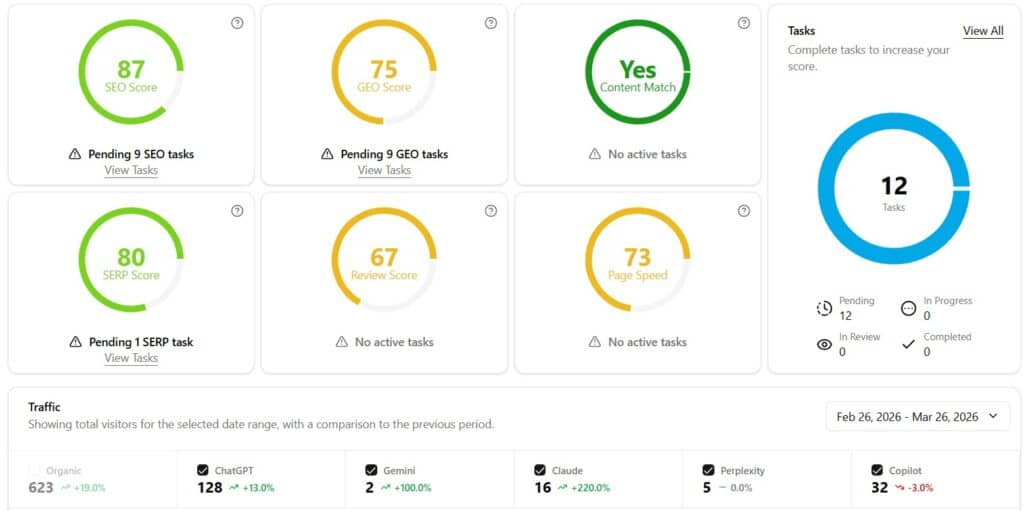
Visibility is measurable: Visby tracks how often your brand appears across prompts and compares it to competitors.

If you want a clearer view of AI visibility without paying enterprise-level prices, this AppSumo deal is worth a look.
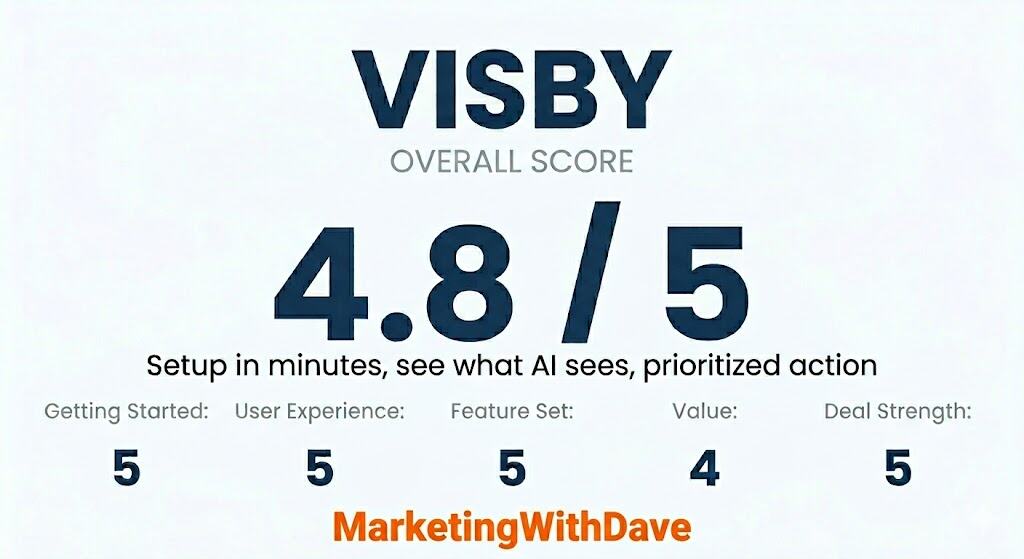
This is a promising tool in an early but increasingly important category. It helps bridge the gap between traditional SEO reporting and how brands actually appear in AI-generated answers.

See how this score is calculated

Here’s how to interpret this score:

The overall score reflects both product quality and how compelling the current deal is.

A score in the high 4 range reflects a strong product with clear value and only minor limitations.

See the AppSumo Deal

Affiliate disclosure: If you buy through my AppSumo link, I may earn a small commission at no additional cost to you. I only share tools I believe are worth your time and consideration.

The 30-Second Decision

Best for: marketers, website owners, and teams that want to track how their brand shows up in AI tools and understand which competitors are surfacing instead.

Not ideal for: anyone expecting a full replacement for traditional SEO platforms or a category that is already fully mature and standardized.

Entry price: Tier 1 starts at $59 lifetime for 1 seat, 1 domain, 10 tracked prompts per domain, and 2 article generations per month.

Risk window: 60-day refund through AppSumo.

My take: Visby addresses a real visibility problem that most marketers are not measuring yet. The mix of prompt tracking, competitor comparisons, AI traffic insights, and prioritized recommendations makes it more practical than many tools in this space.

Try Visby on AppSumo

What Visby Helps You See

Most SEO tools tell you how you rank in search engines.

Visby is focused on a different question: when someone asks an AI assistant about your category, does your brand show up at all?

That matters because AI visibility is becoming its own layer of discovery. If your brand is absent from those answers, you may be missing awareness, traffic, and future demand without realizing it.

Visby helps make that gap visible by tracking prompt-level visibility across AI tools, comparing your presence to competitors, and showing how your position changes over time.

One reason I would treat those visibility numbers as directional rather than absolute: I tested the same prompt across six AI Search tools, including Visby, and found major differences in how they measured and reported visibility. The experiment also showed why seeing the underlying AI response matters just as much as the score.

What Makes It Useful

The strongest part of Visby is that it does more than report what is happening.

It connects visibility tracking with action. Instead of just showing that competitors are being surfaced more often, it also generates prioritized recommendations tied to your website and content.

Examples from my project included improving title uniqueness, strengthening heading structure, adding more descriptive alt text, implementing article schema, and creating a stronger FAQ section with markup.

That makes the tool more useful than a dashboard that simply tells you that you are behind.

It points toward what to fix next.

AI Traffic Is Already Happening

One of the more interesting parts of Visby is its reporting on traffic from AI platforms.
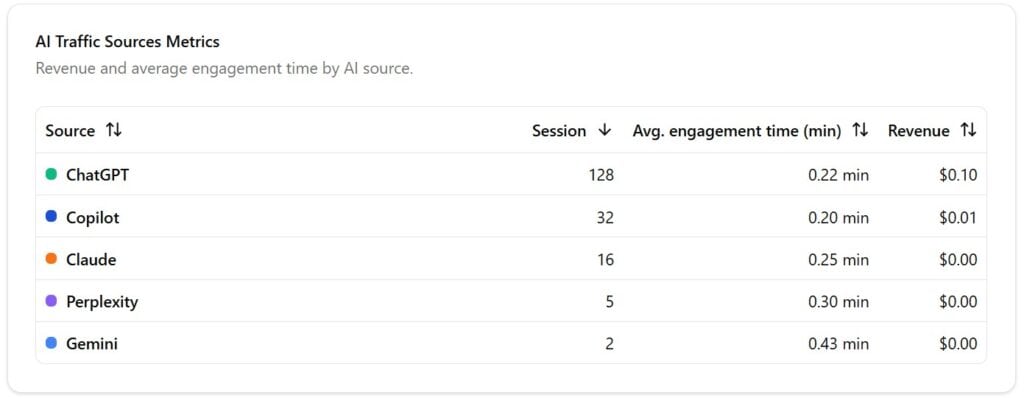
AI traffic is already happening: ChatGPT and other AI tools were already sending visitors to my website.

It breaks out traffic from sources like ChatGPT, Claude, Perplexity, Copilot, and others, which starts to reveal whether AI assistants are already sending visitors to your website.

In my case, ChatGPT was already sending traffic even though my visibility across tracked prompts was still weak.

That matters because it shows this is not just a theoretical trend. AI platforms are already part of the traffic mix, even for websites that are not actively optimizing for AI visibility yet.

The tool also helps show which web pages those visitors are landing on, which gives you a better sense of what content is actually surfacing and getting clicked.
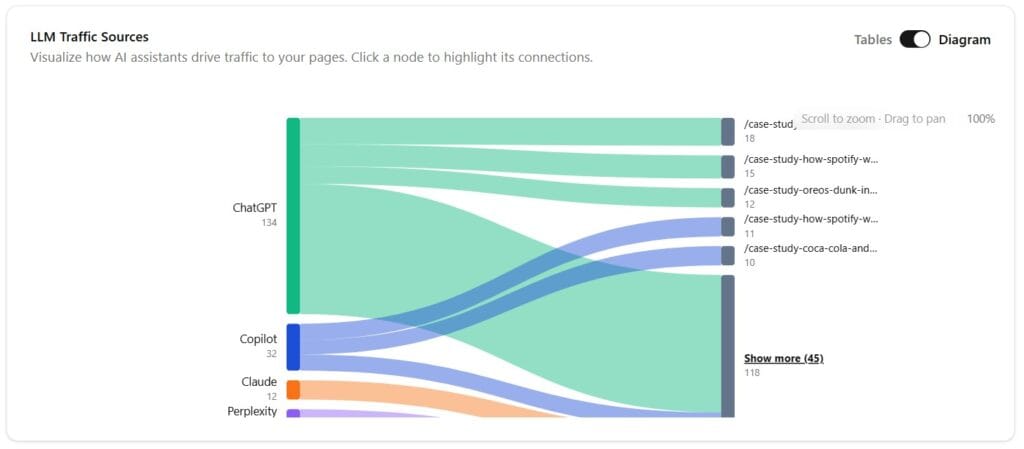
Where AI traffic lands and flows: Entry pages from AI answers and where visitors go next.

Competitor Context Matters

One useful reality check with Visby is that it does not compare you only to businesses your size.

It shows which websites AI systems are already trusting in your space.

In my case, that meant being compared against much larger and more established brands like HubSpot, Moz, and Neil Patel.

That can be humbling, but it is also useful. It gives you a clearer picture of the actual competitive landscape inside AI-generated answers, not just the one you assume you are in.
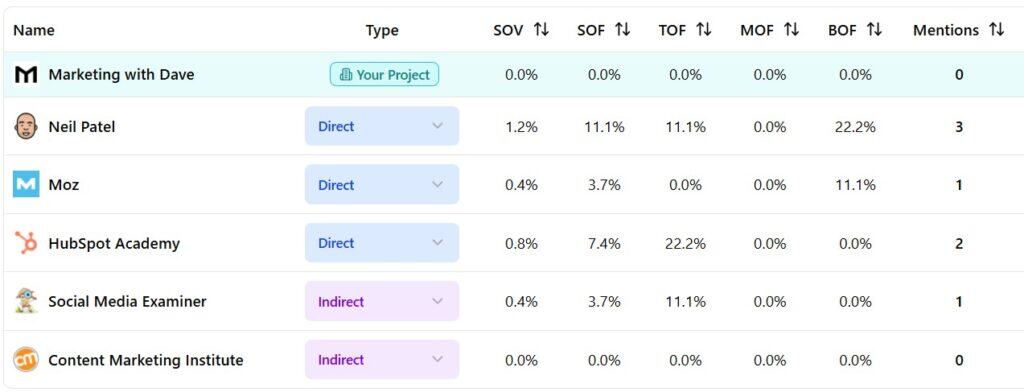
AI visibility is competitive: Larger brands like HubSpot and Moz are already being surfaced more often in AI answers.

Setup and Ease of Use

Setup is fairly straightforward.

You add your domain, connect data sources like Google Analytics and Google Search Console, define tracked prompts, and add competitors. From there, the platform starts building a picture of how your brand appears across AI assistants.

For an early-stage category, the product feels approachable and practical. It delivers clear reporting, useful comparisons, and a stronger connection between visibility data and next steps than I expected.

Plans and Pricing

Tier 1 is $69 lifetime for 1 seat, 1 domain, 10 tracked prompts per domain, and 2 article generations per month.

Higher tiers increase seats, domains, tracked prompts, and article generation limits.

For someone who mainly wants to validate whether AI visibility tracking is useful for their business, Tier 1 looks like a reasonable starting point.

If you need broader coverage across multiple domains, more prompts, or more team access, you would likely need to move up tiers.

Check current pricing and tiers

Why I Would Recommend This

  1. AI visibility is becoming a real part of digital discovery, and most marketers are not measuring it at all.
  2. Visby helps connect prompt tracking, competitor analysis, and prioritized recommendations in one place.
  3. The platform surfaces AI traffic data in a way that is easier to understand and act on.
  4. The lifetime price is low enough to make testing this category more realistic for smaller teams and independent marketers.

What To Watch Out For

  1. This is not a replacement for your traditional SEO stack.
  2. The category is still evolving, so the signals and frameworks are not as mature as classic search reporting.
  3. Competitor comparisons may feel discouraging at first if AI tools already favor much larger brands in your niche.
  4. If your positioning is unclear, this tool may expose that quickly.

Bottom Line

Most marketers still have very little visibility into how AI assistants talk about their brand, who gets cited instead, or whether any AI platforms are already sending them traffic.

Visby helps make that clearer.

Its value is not just in the reporting. It is in the combination of prompt-level visibility, competitor context, AI traffic insights, and prioritized recommendations that help turn insight into action.

If you expect a polished enterprise SEO platform, this is not that.

If you want a practical way to start understanding and improving AI visibility, Visby is worth a serious look.

View the Visby AppSumo Deal

Disclaimer

This content is for educational purposes and reflects my experience and research. Always evaluate tools based on your specific business needs, goals, and workflows before making a decision.

Looking for more marketing software reviews? See my full list of marketing tools and software I recommend.

Visby Review: AI Search Visibility and GEO Monitoring Tool Read More »
case study openai chatgpt monetization pivot 1

Case Study: OpenAI’s Monetization Pivot From Free AI to ChatGPT Plus

Reading Time: 4 minutes

Brief Summary

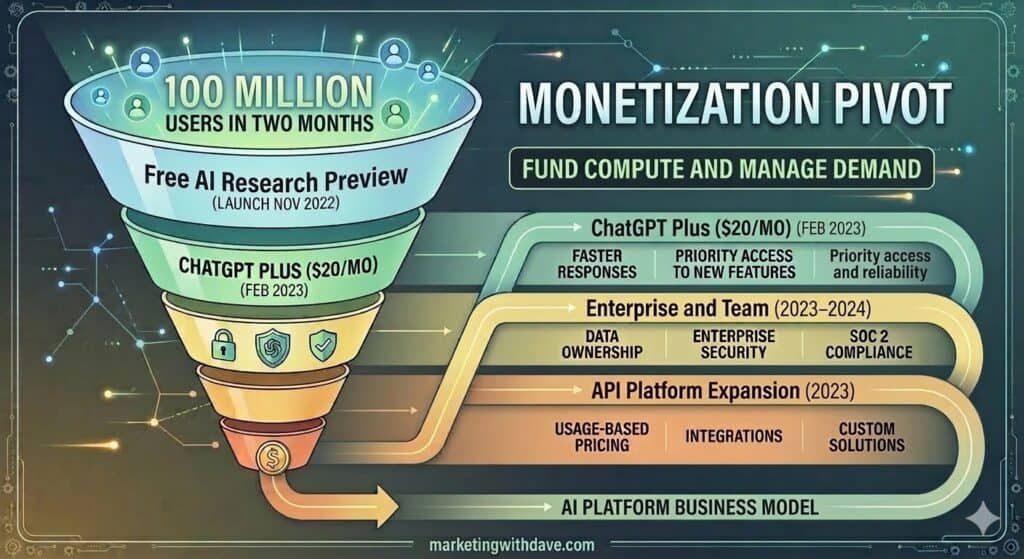
OpenAI launched ChatGPT as a free research preview to maximize adoption, collect feedback, and establish product habit. After rapid viral growth, it introduced paid tiers to manage demand and fund compute: ChatGPT Plus for individuals, enterprise offerings for organizations, and usage-based monetization through the API platform.

Over time, OpenAI layered additional tiers and began testing ads on lower-cost plans while publicly emphasizing that ads would not influence answers, highlighting the central tension in its monetization strategy: scale revenue while protecting trust, privacy, and a mission-led brand.

Company Involved

OpenAI (openai.com) is the organization at the center of this case study, with ChatGPT as the primary consumer product that created a mass-market funnel for paid subscriptions and enterprise adoption.

Marketing Topic

  • Strategy
  • Product positioning
  • Customer experience

Public Reaction or Consequences

ChatGPT’s free research preview turned into a cultural moment and a usage surge so large that it created both opportunity and pressure. OpenAI’s early positioning emphasized learning from users and collecting feedback, with free access during the research preview.

The product’s adoption curve quickly became part of the story itself. Reuters reported a UBS estimate that ChatGPT reached 100 million monthly active users in January 2023, roughly two months after launch, with Similarweb data cited in the same report. That scale made monetization feel less like an optional business decision and more like an inevitable next step to support infrastructure costs.

The subscription rollout for ChatGPT Plus introduced a clear trade: pay to avoid capacity constraints and get priority access. OpenAI framed Plus around general access during peak times, faster responses, and priority access to improvements.

As organizations began experimenting with ChatGPT, the dominant friction shifted from capability curiosity to risk concerns: data privacy, compliance, and deployment control. OpenAI’s enterprise positioning directly addressed those buyer objections, emphasizing ownership and control of business data, a claim that enterprise data is not used for training, plus security and compliance signals such as SOC 2 and encryption.

Why It Matters Today

• Freemium can be a deliberate research and distribution strategy when feedback loops and habit-formation are part of the product’s defensibility.

• Subscription tiers can be positioned around access and reliability first, which is often easier to sell than abstract feature bundles during rapid growth.

• Enterprise monetization in AI is as much about trust, security, and data governance as it is about model capability.

• AI vendors are increasingly balancing subscriptions with advertising on lower-cost tiers, but the trust constraints are higher than traditional search or social products because users treat conversations as personal and sensitive.

• OpenAI’s public messaging shows a modern monetization tension: fund compute-intensive products while insisting mission, privacy, and answer quality remain protected.

Takeaways and Notable Data

1. Freemium can be your fastest distribution channel, but it only works long-term if you design clear conversion paths tied to user pain, such as access, latency, or higher usage limits.

2. Enterprise monetization requires trust features that product marketing can explain in plain language: data ownership, training exclusions, and compliance signals that procurement teams recognize.

3. If you introduce ads in an AI assistant, you must explicitly separate incentives from outputs and communicate privacy boundaries, or you risk breaking the user’s mental model of objective assistance.

Notable Quotes and Data:

• Reuters reported a UBS estimate that ChatGPT reached 100 million monthly active users in January 2023, two months after launch.

• OpenAI priced ChatGPT Plus at $20 per month and positioned it around better access during peak times, faster responses, and priority features.

• OpenAI positioned ChatGPT Enterprise around business data control and stated it does not train on business conversations, while also highlighting SOC 2 compliance and encryption.

Full Case Narrative

OpenAI’s monetization story is easier to understand if you separate the narrative into three layers: a consumer growth engine, an enterprise trust engine, and a developer usage engine.

The consumer growth engine began with a research-preview framing. OpenAI introduced ChatGPT as a way to gather user feedback on strengths and weaknesses, and stated that usage was free during the research preview.

This free access acted like a massive public demo, and it turned the product into a social object that people shared. Reuters reported that ChatGPT was made available for free public testing on November 30, 2022, and that usage quickly reached over a million users within about a week.

Once the flood of demand was undeniable, OpenAI’s next challenge was sustainability. OpenAI has described the capital intensity of building advanced AI and said it estimated needing to raise on the order of $10 billion to build AGI, linking mission ambition directly to funding requirements.

The first mainstream consumer monetization step was ChatGPT Plus, positioned around reliability and access rather than only features.

Next came the enterprise trust engine, positioned around ownership and control of business data, training exclusions, and compliance signals such as SOC 2 and encryption.

In parallel, the developer usage engine monetized through the API platform with token-based pricing. OpenAI documented that, as of March 1, 2023, data sent to the OpenAI API is not used for training unless a customer opts in.

Over time, OpenAI expanded segmentation through additional plans, and then moved toward advertising on lower-cost tiers while stating that ads do not influence answers and that conversations remain private from advertisers.

Timeline

• November 30, 2022: ChatGPT launched for free public testing as a research preview.

• February 2023: ChatGPT Plus launched at $20 per month.

• March 1, 2023: OpenAI documented that API data is not used for training unless customers opt in.

• August 2023: ChatGPT Enterprise announced with enterprise security and privacy positioning.

• January 2024: ChatGPT Team introduced for self-serve business adoption.

• December 2024: ChatGPT Pro introduced at $200 per month.

• January to February 2026: OpenAI announced and began testing ads for Free and Go tiers, alongside published trust and privacy commitments.

What Happened Next?

Reuters reported that OpenAI’s CFO said annualized revenue exceeded $20 billion in 2025, alongside a major increase in computing capacity, reinforcing the business logic behind layered monetization.

One Sentence Takeaway

A free research preview created the largest possible top-of-funnel for habit formation, and OpenAI monetized the resulting demand by selling reliability, trust, and integration while trying to protect the integrity of its answers.

Sources and Citations

OpenAI: Introducing ChatGPT Plus

OpenAI: Introducing ChatGPT

Reuters: ChatGPT Sets Record for Fastest-Growing User Base

OpenAI: API Pricing

TechCrunch: OpenAI Launches ChatGPT Plus, Starting at $20 Per Month

Case Study: OpenAI’s Monetization Pivot From Free AI to ChatGPT Plus Read More »

track page types in google analytics 4 using google tag manager

Track Page Types in Google Analytics 4 Using Google Tag Manager

Reading Time: 6 minutes

If you want better content analysis in Google Analytics 4, tracking just URLs is not enough. A list of individual web pages can tell you what got traffic, but it does not make it easy to understand which kinds of content are actually driving your website forward.

That is where page type tracking can help. Instead of only measuring individual URLs, you can classify each web page by format and send that value into GA4 as a custom parameter. This makes it possible to analyze performance by content type, such as case studies, book summaries, calculators, site search, the home page, and anything that does not yet fit into a defined bucket.

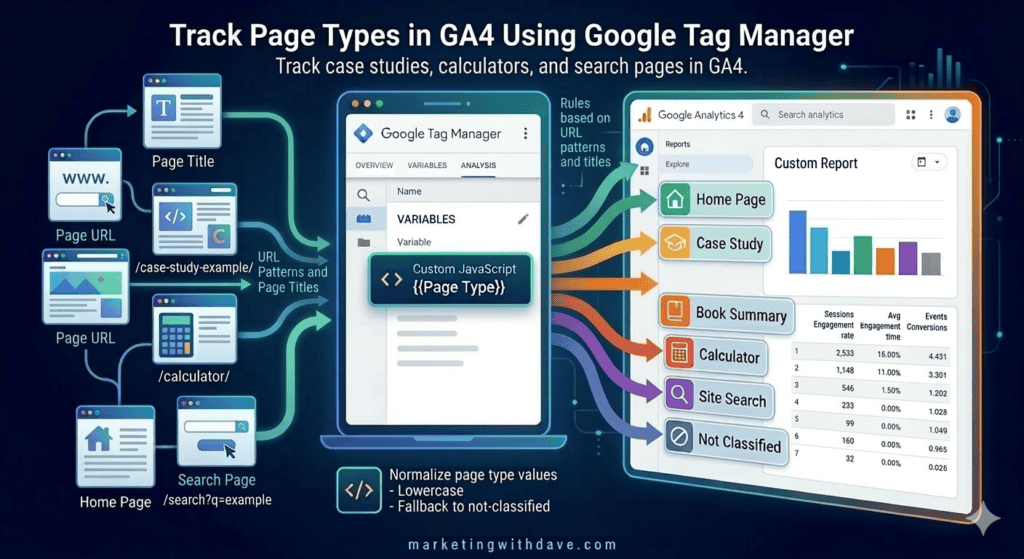
In my case, I used Google Tag Manager to identify page types based on URL patterns and page titles, then passed that value to GA4 using a custom parameter called page_type.

What page type tracking does

Page type tracking adds a structural content layer to your analytics. Instead of only seeing that a specific web page got traffic, you can now understand whether that traffic came from a case study, a calculator, a book summary, a home page visit, or some other kind of content.

Examples of page type values might include:

home-page
case-study
book-summary
calculator
site-search
404
not-classified

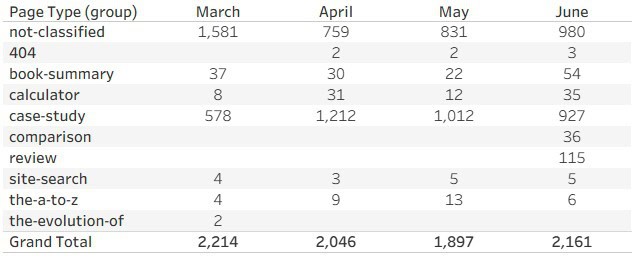
Once the custom dimension had been collecting data for a few months, I could finally analyze traffic by page type instead of individual URLs. Here’s what that report looks like on my own site.

Table showing page type data for March to June, including not-classified, 404, book-summary, calculator, case-study, comparison, review, site-search, the-a-to-z, the-evolution-of, and grand total.
Notice that “not-classified” is the largest bucket today. As I create more page type rules over time, I expect that category to continue shrinking.

Why page type tracking is useful in GA4

Once page type is available as a custom dimension, GA4 becomes much more useful for content analysis.

You can answer questions like:

  1. Which page types attract the most sessions?
  2. Which page types drive the strongest engagement?
  3. Which page types are most likely to bring in organic traffic?
  4. How much of my website still falls into a general not-classified bucket?

This becomes even more powerful when combined with topic tracking, because you can analyze both the format of the web page and the subject of the content.

Before you start

This walkthrough presumes:

1. You are using Google Tag Manager.

2. Your GA4 page_view event is firing through GTM.

3. Your website has consistent URL patterns or titles that can be used to identify different page types.

4. You want page types to be stable over time and mutually exclusive.

Why page type rules need to be precise

A page type should describe the format of the content, not the topic. For example, case study is a page type. Martech is a topic. Those are different things and should be tracked separately.

The goal is to give each web page one clear page type value. That keeps the classification stable and makes reporting easier to trust.

It is also important not to create too many page types too quickly. A small, meaningful set is usually better than trying to classify every edge case on day one.

Step 1: Define your page type values

Start by deciding which page types your website actually needs. In my setup, I used these values:

home-page
case-study
book-summary
calculator
site-search
404
not-classified

The first several values represent meaningful content structures. The final value, not-classified, acts as an intentional catch-all bucket.

Why not-classified matters

If no matching rule is found, the script returns not-classified.

This is not a mistake. It is a useful fallback. It gives you a deliberate “other” bucket so that uncategorized web pages do not get confused with GA4 system labels like not set. Over time, monitoring the percentage of sessions tied to not-classified can help you decide whether more page types are needed or whether the current taxonomy is already healthy.

Step 2: Create a Custom JavaScript Variable in Google Tag Manager

In GTM, create a new User-Defined Variable using the Custom JavaScript variable type.

Name it something like:

Page Type

Then use logic that checks the current URL path and page title to determine the correct page type.

Here is an example:

function() {

var path = window.location.pathname.toLowerCase();
var url = window.location.href.toLowerCase();
var title = document.title.toLowerCase();

if (
  title.includes("marketing with dave - all things digital marketing") ||
  title.includes("marketing with dave | all things digital marketing")
) {
  return "home-page";
}

if (title.includes("404")) {
  return "404";
}

if (url.includes("/search/?q=")) {
  return "site-search";
}

if (path.includes("case-study")) {
  return "case-study";
}

if (path.includes("book-summary")) {
  return "book-summary";
}

if (path.includes("the-a-to-z")) {
  return "the-a-to-z";
}

if (path.includes("the-evolution-of")) {
  return "the-evolution-of";
}

if (
  path.includes("calculator") ||
  path.includes("analyzer") ||
  path.includes("tools")
) {
  return "calculator";
}

return "not-classified";

}

How the script works

This script checks a small set of rules in order.

1. It looks for the home page title.

2. It checks for a 404 title.

3. It checks for a site search URL pattern.

4. It checks for specific URL structures like case-study, book-summary, the-a-to-z, and the-evolution-of.

5. It checks for calculator-related words in the URL.

6. If no match is found, it returns not-classified.

The order matters. More specific rules should always come before the fallback bucket.

Step 3: Add page_type to your GA4 page_view tag

Once the variable is created, open the GA4 page_view tag in Google Tag Manager.

If you have both a standard page_view tag and an internal version, update both so the data stays consistent.

In Event Parameters, add:

page_type = {{Page Type}}

This tells GTM to send the resolved page type value with each page_view event.

Step 4: Preview your changes in GTM

Before publishing, use Preview mode in GTM.

Visit several web pages on your website and verify that the variable returns the right values.

Examples:

A case study URL should return case-study.

A book summary URL should return book-summary.

A calculator or analyzer web page should return calculator.

The website home page should return home-page.

A regular article that does not match any defined rule should return not-classified.

Step 5: Publish the GTM container

Once Preview mode confirms the values are correct, publish the GTM container.

At that point, GTM is sending the page_type parameter to GA4, but GA4 still needs one final setup step before you can use it in reporting.

Step 6: Register the custom dimension in GA4

In GA4, go to Admin, then Custom definitions.

Create a new custom dimension with these settings:

Dimension name: Page Type

Scope: Event

Event parameter: page_type

Save the dimension.

From that point forward, GA4 will store and report on the page_type parameter.

Important note about historical data

GA4 custom dimensions are not retroactive.

This means page type data will only be available for traffic collected after the GTM changes are published and the custom dimension is created.

If you want a historical view, you would need to recreate it manually using existing URLs in a spreadsheet or another reporting layer.

How to analyze page type in GA4

Once the data starts flowing, one of the simplest and most useful reports is an Exploration showing sessions by page type.

A basic starting point is:

Rows: Page Type

Values: Sessions

This quickly shows what percentage of traffic is going to case studies, calculators, book summaries, site search, and everything else.

You can also combine page type with content topic to build a matrix like:

Rows: Content Topic

Columns: Page Type

Values: Sessions

That helps you understand both what the content is about and what format it takes.

Why this works well for content-driven websites

If your website includes multiple recurring content formats, page type tracking gives you a much better structural view of performance.

Instead of relying only on individual URLs, you can now see how the website performs by content model.

That is useful for editorial planning, content investment decisions, and identifying which kinds of web pages are becoming your strongest entry points.

Final takeaway

Page type tracking is one of the most useful content upgrades you can make in GA4. It adds a structural layer that makes your reporting far more meaningful than a simple list of URLs.

If your website already has recognizable URL patterns or stable page titles, Google Tag Manager can classify those web pages automatically and send the values into GA4 with very little maintenance required later.

And by keeping not-classified as an intentional fallback, you retain visibility into the portion of your website that still sits outside your current content taxonomy.

Track Page Types in Google Analytics 4 Using Google Tag Manager Read More »

Analyzing content trends infographic showing WordPress category tracking with GTM and GA4 for marketing analytics and data-driven insights.

Setting Up WordPress Category Tracking in Google Tag Manager for GA4

Reading Time: 5 minutes

If you run a content-heavy WordPress website, there is a good chance you care about more than just web page views. You may also want to know which content topics actually drive sessions, engagement, and returning visitors.

That is where category tracking can help. In my case, I wanted Google Analytics 4 to capture the WordPress Category assigned to each article so I could analyze traffic by topic. This is especially useful when your content spans areas like analytics, martech, paid advertising, SEO, content marketing, and more.

The important detail is that WordPress Categories and WordPress Tags are different. If your website uses Categories as the main topic label on articles, your Google Tag Manager setup needs to pull from the Category link, not from a Tag link.

What this setup does

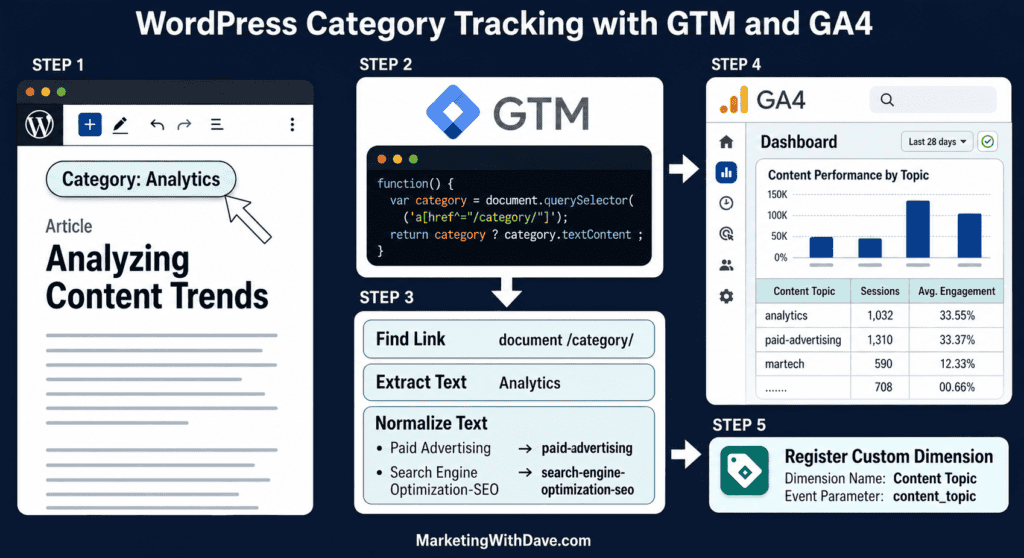
This approach reads the article’s visible WordPress Category from the web page, normalizes it into a GA4-friendly value, and sends it with your page_view event as a custom parameter.

For example:

Martech becomes martech

Paid Advertising becomes paid-advertising

Search Engine Optimization (SEO) becomes search-engine-optimization-seo

Artificial Intelligence (AI) becomes artificial-intelligence-ai

Why use Category tracking in GA4?

Once this is set up, you can analyze website performance by topic instead of just by URL.

This lets you answer questions like:

Which categories attract the most sessions?

Which categories drive the longest engagement time?

Which categories perform best for case studies, calculators, or other content types?

If you already have page type tracking in place, category tracking becomes even more powerful because you can compare format and topic together.

Before you start

This walkthrough presumes:

1. You are using WordPress.

2. Your article category appears visibly on the web page as a link.

3. The category link uses a URL structure containing /category/.

4. You already have Google Tag Manager installed.

5. Your GA4 page_view tag is firing through GTM.

Step 1: Confirm that your website uses Categories, not Tags

This part matters more than people realize.

If your website displays the topic label under the title and that label links to a URL like /category/martech/, then your GTM script should look for Categories.

If your setup uses WordPress Tags instead, the link would usually contain /tag/.

Step 2: Create a Custom JavaScript Variable in Google Tag Manager

In Google Tag Manager, go to Variables and create a new User-Defined Variable.

Choose Custom JavaScript as the variable type.

Name it something like:

Content Topic

Then use this script:

Some tutorials detect categories using URL patterns like /category/. That works on some WordPress websites, but many themes remove the category base from URLs. A more reliable approach is to target the category element directly in the HTML.

function() {
  var category = document.querySelector('.ast-terms-link a');
  if (!category || !category.textContent) return 'not-classified';

  return category.textContent
    .trim()
    .toLowerCase()
    .replace(/[()]/g, '')
    .replace(/\s+/g, '-')
    .replace(/[^a-z0-9-]/g, '')
    .replace(/-+/g, '-')
    .replace(/^-|-$/g, '');
}

Note: The selector .ast-terms-link a works for Astra theme. If you are using a different theme, inspect the category link on the web page and adjust the selector accordingly.

How the script works

This script does five things:

1. It looks for the first link on the web page that contains /category/.

2. It grabs the visible text of that link.

3. It trims extra spaces.

4. It converts the value to lowercase.

5. It removes special characters and replaces spaces with hyphens.

If no category is found, it returns not-classified.

This acts as a deliberate “other” bucket. Instead of mixing uncategorized traffic with GA4 labels like not set, you can clearly see what portion of your content taxonomy is missing or incomplete. Over time, the goal is not to eliminate not-classified, but to keep it at a healthy percentage.

Step 3: Add the parameter to your GA4 page_view tag

Next, open the GA4 page_view tag in Google Tag Manager.

If you have a standard page_view tag and a separate internal version, make sure you update both so the data stays consistent.

In the Event Parameters section, add a new parameter:

content_topic = {{Content Topic}}

That tells GTM to send the normalized category value with every page_view event.

Step 4: Preview the changes in GTM

Before publishing, use Preview mode in Google Tag Manager.

Open a few different article web pages and confirm that the Content Topic variable returns values you expect from your WordPress Categories.

For example, on a Martech article, the variable should return:

martech

On a Paid Advertising article, it should return:

paid-advertising

If you see a value that does not match one of your approved categories, your selector may be pulling from the wrong part of the web page.

Step 5: Publish the GTM container

Once preview mode looks good, publish the container.

At this point, GTM is sending the custom parameter to GA4, but Google Analytics 4 still needs one more step before you can use it in reports.

Step 6: Register the custom dimension in GA4

In GA4, go to Admin, then Custom definitions.

Create a new custom dimension with the following settings:

Dimension name: Content Topic

Scope: Event

Event parameter: content_topic

Save the custom dimension.

From that point forward, GA4 will store and report on the content_topic parameter.

Important note about historical data

GA4 custom dimensions are not retroactive.

That means this setup will only classify data collected after the custom dimension is created and GTM is published.

If you want historical analysis, you will need to build it manually using a spreadsheet or another reporting layer.

How to use the data in GA4

After the data starts flowing, the easiest place to analyze it is in Explorations.

A simple starting report is:

Rows: Content Topic

Columns: Page Type

Values: Sessions

This makes it easy to see which topics are driving traffic and how those topics map to different kinds of content.

Examples might include:

Case studies in martech

Book summaries in leadership

Articles in analytics

Calculators in website-related topics

Why this works well for WordPress websites

The biggest advantage of this setup is that it uses the taxonomy you already maintain in WordPress.

You are not inventing a separate analytics classification system. You are simply exposing your existing editorial structure to GA4.

That makes the reporting much easier to trust.

Can this work outside WordPress?

Yes, but the implementation details change.

The broader concept is the same: identify the topic label on the web page, extract it with GTM, normalize it, and send it to GA4 as a custom parameter.

What changes is the selector. Instead of looking for a WordPress Category link containing /category/, another platform might use a different class name, data attribute, or metadata element.

So the process is portable, but the selector is platform-specific.

Final takeaway

If your WordPress website uses Categories as the primary topic label for articles, GTM should pull from Categories and not Tags. That one detail can be the difference between clean, trustworthy GA4 topic reporting and a messy dataset you cannot rely on.

Once you set this up, GA4 becomes much more useful for understanding what your content is really doing by subject area, not just by individual URL.

Setting Up WordPress Category Tracking in Google Tag Manager for GA4 Read More »

when should you change your facebook ads 2

When Should You Change Your Facebook Ads? The Data Milestones That Tell You It’s Time

Reading Time: 7 minutes

One of the easiest ways to hurt a Facebook ad campaign is to make changes before the campaign has gathered enough data to teach you anything useful. That is especially true for small local campaigns with limited budgets, tight geography, and simple goals like driving landing page visits and form submissions.

That was the lesson from a recent local business campaign. We were running ads in two neighboring cities, later preparing to expand into a third city, with the goal of getting local businesses to visit the website and reach out about being included in our welcome baskets. Because the website was on a Squarespace tier that does not support deeper tracking tools, landing page views became our best working proxy for intent.

That limitation forced a more disciplined approach. Instead of constantly tweaking the campaign, we had to define mileposts that would tell us when to leave things alone, when to test something new, and when there was finally enough signal to optimize with confidence.

Although the example in this article comes from a Facebook campaign, the discipline behind the milestone framework applies to almost any paid media platform. Google Ads, LinkedIn Ads, TikTok Ads, and other platforms all face the same fundamental challenge: marketers often make changes before the campaign has collected enough data to justify the decision. The milestones described here are less about Facebook itself and more about developing a structured approach to campaign learning.

Why landing page views mattered so much

In a perfect world, every campaign would optimize toward actual business outcomes like leads, calls, booked meetings, or purchases. In this case, those deeper signals were not fully available. That meant the cleanest measurement available was whether someone clicked through and actually loaded the web page.

In an ideal world, every campaign would optimize around the final business outcome: purchases, qualified leads, booked calls, or revenue. Unfortunately, many campaigns operate with incomplete measurement. Legacy websites, privacy restrictions, or platform limitations can make it difficult to track the exact action you care about.

That is why landing page views became the primary operating metric. It is not the final business outcome, but it is much better than relying on impressions, clicks, or generic engagement. A landing page view at least tells you the ad was compelling enough to earn a visit and the user stayed long enough for the web page to load.

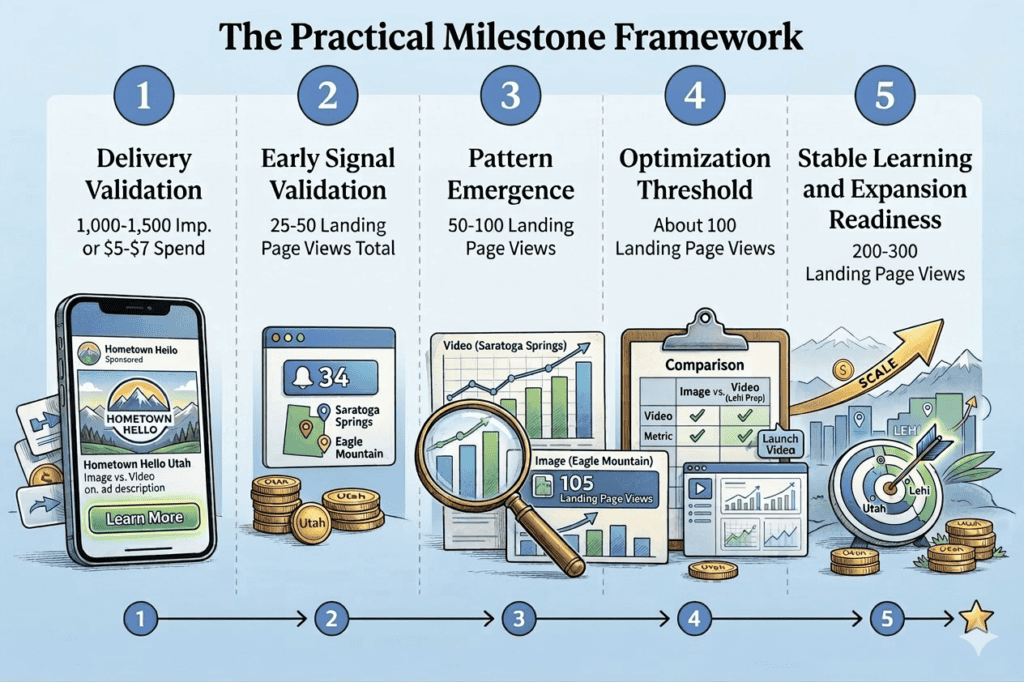
The practical milestone framework

The following framework is the one I would recommend for local advertisers running smaller campaigns with limited tracking. It is not built around theory alone. It reflects what happened in a real campaign and the points where the data was and was not trustworthy.

Milestone 1: Delivery validation

Do not touch anything until each ad set has either roughly 1,000 to 1,500 impressions or about $5 to $7 in spend. At this stage, the goal is not optimization. The goal is simply to confirm that the campaign can deliver.

This first milestone answers basic questions.

  1. Is the audience too small?
  2. Is the ad approved?
  3. Are impressions coming in?
  4. Is Meta serving the creative at all?

If the answer is yes, then the campaign has passed the first gate. At this stage, changing copy, turning placements on and off, or introducing new creative usually creates more confusion than insight.

Milestone 2: Early signal validation

Once the campaign reaches about 25 to 50 landing page views total, you can start to look for directional signals. This is still too early for strong conclusions, but it is enough to tell whether the campaign is fundamentally broken or viable.

This is where you look for things like whether landing page views are happening at all, whether one placement is consuming spend without results, and whether costs are wildly out of line. What you should not do yet is start making aggressive structural changes based on tiny differences.

This stage is about validating that the campaign deserves more time.

Milestone 3: Pattern emergence

At around 50 to 100 landing page views, repeatable patterns start to appear. This is the point where you can begin to see whether one city is stronger than another, whether one placement is consistently carrying the campaign, and whether one media type appears more promising.

This is also the earliest point where introducing a new creative format, such as video when you started with image only, becomes reasonable. The key is that the original campaign must first prove that it can generate real visits.

Before this point, adding more variables usually muddies the learning. After this point, adding one new variable can be productive.

Milestone 4: Optimization threshold

At around 100 landing page views, you finally have enough data to make modest optimizations with some confidence. This is where you can begin comparing image versus video, evaluating whether placements should be trimmed, and deciding whether a rising cost per landing page view is a real pattern or just normal noise.

If you started with image ads only, this is the point where it makes the most sense to launch a video version. If you already added video earlier as an observational test, this is the point where the comparison starts to become meaningful.

This is also the stage where dashboards become much more useful. Before this, they mostly confirm delivery. After this, they begin to reveal real trends.

Milestone 5: Stable learning and expansion readiness

Once a campaign reaches 200 to 300 landing page views, it moves from testing into stable pattern recognition. At this point, you can start making more meaningful decisions such as introducing new cities, testing a second wave of creatives, splitting image and video more intentionally, or increasing budgets gradually.

This is not the same as saying the campaign is fully mature. It simply means there is finally enough signal to make more than tiny changes without guessing.

What this looked like in a real campaign

In our campaign, image ads launched first. That was the right call because it simplified the initial learning. Once the campaign had enough landing page views to show the ads were viable, video was introduced. Over time, the data showed that video was competitive and in some cases more efficient than image, especially in certain cities.

At the same time, there were also signs that performance softened after the first month. Landing page views dropped in month two and three relative to spend. That did not automatically mean the campaign was broken. Frequency remained healthy, which suggested the issue was not simple audience saturation. The more likely explanations were a combination of creative fatigue, small-budget volatility, and Meta shifting spend toward placements that generated more impressions but less efficient traffic.

That is exactly why milestone-based decision making matters. Without those thresholds, it is too easy to panic after one bad week or overreact to one strong placement.

Best practices that matter more than people think

Use one primary metric for operating decisions

If you do not have backend conversion tracking, pick the best proxy and commit to it. In this case, landing page views were the right choice. Do not bounce between impressions one week, clicks the next, and vague “engagement” after that. That creates chaos.

Keep variables isolated whenever possible

If you want to know whether video works better than image, the cleanest answer comes from isolating format. If you change the media, the copy, the placements, and the geography all at once, you have not really run a test. You have just changed everything.

Do not trust low-volume placement results too quickly

A placement that produced one cheap landing page view is not automatically a winner. The campaign needs enough data to show a repeated pattern before you start trimming or expanding based on placements.

Use clear naming conventions for campaigns and creatives

One of the most useful discipline moves in this campaign was naming ads clearly by city, creative type, and version. That made reporting possible even when Meta’s own reporting labels were messy. Clean naming is not glamorous, but it is one of the easiest ways to keep future analysis honest.

Do not let Meta’s warnings bully you into bad placements

Meta often recommends enabling more placements. Sometimes that helps with delivery. Sometimes it just opens the door to cheaper but lower-quality inventory. The right response is not to ignore all recommendations or accept all of them. The right response is to compare the recommendation against actual campaign data.

Do not confuse low frequency with strong creative

A healthy frequency tells you you are probably not exhausting the audience yet. It does not prove the creative is still sharp. A campaign can still lose efficiency because the message is getting stale or because Meta is drifting into weaker delivery patterns.

When to refresh creative

Creative refreshes should be driven by pattern, not boredom. If frequency stays modest but cost per landing page view rises over several weeks, that is a strong signal that the creative may need fresh energy. That does not always require a complete reinvention. Sometimes it simply means introducing one new image ad and one new video ad while keeping the core offer and call to action consistent.

The safest practical workflow is to duplicate the current ad, replace only the media, rename it clearly, launch it, and then pause the old creative once the new one is live. That keeps reporting cleaner and prevents tiny budgets from being split across too many active creatives.

When to expand geography

New locations should usually be added only after the existing campaign has shown stable enough performance to justify expansion. In our case, city one and city two were kept separate because they are neighboring cities and overlapping targeting would have made the reporting much harder to trust. Adding the third city made sense only after the campaign had delivered enough traffic to show that the structure itself was viable.

If you expand into a new city too early, you risk multiplying uncertainty rather than scaling what works.

A simple way to think about the phases

There is a useful way to summarize the whole framework:

At around 50 landing page views, observe. At around 100 landing page views, optimize carefully. At around 200 to 300 landing page views, expand with more confidence.

That is not a law. It is a practical operating model that keeps advertisers from making emotional decisions too early.

Final takeaway

If a campaign is underperforming, the answer is not always to make changes immediately. Sometimes the smartest move is to leave the campaign alone until it has actually earned the right to be judged.

That discipline is especially important in local campaigns with limited budgets, smaller audiences, and imperfect tracking.

The most dangerous thing in paid social is not bad data. It is acting too confidently on too little of it.

If you can define clear milestones before you touch the campaign, you give yourself a far better chance of making decisions that improve performance instead of resetting learning over and over again.

The specific metric you use may vary — purchases, leads, or the best proxy metric available — but the discipline remains the same: wait until the campaign has gathered enough signal before making the next decision.

When Should You Change Your Facebook Ads? The Data Milestones That Tell You It’s Time Read More »

a practical martech stack for small businesses 1

A Practical Martech Stack for Small Businesses

Reading Time: 6 minutes

Martech Does Not Need to Be Overwhelming

Scott Brinker’s martech landscape is one of the best known attempts to organize the marketing technology world. It helps show just how many tools exist and how broad the category has become.

That is useful, but it can also be overwhelming.

Most small businesses do not need dozens of platforms. They need a practical stack made up of a few tools that support the basics: a website, measurement, search visibility, content creation, privacy, and optimization. They also need a CRM to manage customers and revenue, but CRM decisions usually involve sales and leadership teams and often sit outside day-to-day marketing tool selection.

This is where Brinker’s framework is helpful. Rather than looking at thousands of logos, small businesses can start by understanding the six major martech categories and then choosing a small set of tools that fit their actual needs.

The Six Martech Categories

Scott Brinker’s framework organizes martech into six broad categories:

  1. Advertising and Promotion
  2. Content and Experience
  3. Social and Relationships
  4. Commerce and Sales
  5. Data
  6. Management

Not every small business needs tools in every category right away. In fact, many do better by starting small and adding tools only when a real need appears.

The Essential Martech Stack for Small Businesses

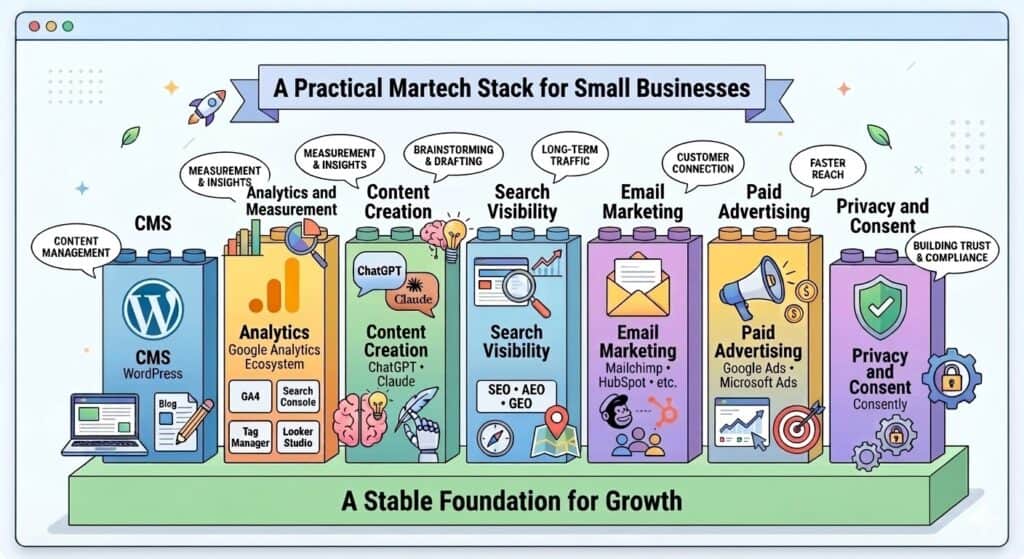
Here is a much more practical view of martech for a small business. This stack maps a small set of practical tools to Brinker’s six martech categories. Instead of trying to cover everything, this stack focuses on seven tools or platforms that support the essentials.

1. Content Management System (CMS): WordPress
Category: Content and Experience

For many small businesses, the website is the center of their marketing. WordPress powers more than 40 percent of all websites on the internet and remains one of the most practical options because it provides flexibility and control.

You can manage content, access the backend, install plugins, add scripts, and grow the website over time.

WordPress itself is free open-source software, but most businesses will need to pay for web hosting in order to run it.

2. Marketing Analytics and Measurement: Google Analytics Ecosystem
Category: Data

A strong marketing foundation begins with measurement. Small businesses need to understand how people find their website, what they do once they arrive, and how marketing activities contribute to traffic and engagement. Roughly 55–60 percent of websites that use analytics rely on Google Analytics, making it the most widely used analytics platform globally.

One of the advantages for small businesses is that some of the most widely used analytics tools are completely free and work seamlessly together.

A practical measurement stack often includes:

  • Google Analytics 4
  • Google Search Console
  • Google Tag Manager
  • Google Looker Studio

Together these tools form a powerful analytics ecosystem used by millions of websites. Even better, the cost to get started is zero.

3. Content Creation and Marketing Assistance: ChatGPT and Claude
Category: Content and Experience

Marketing often requires producing a wide range of content, including blog posts, ad copy, email messaging, social media posts, and promotional materials. Tools like ChatGPT and Claude can help marketers brainstorm ideas, outline content, draft copy, summarize research, and refine messaging.

These tools can also assist with tasks that often fall outside a marketer’s core skill set. For example, they can help generate image prompts, modify graphics, troubleshoot small development issues, or assist with simple code adjustments when a designer or developer is not available.

Many marketers now use tools like ChatGPT or Claude as creative and technical assistants. Even the free plans can provide meaningful productivity gains for content creation and everyday marketing tasks.

Used thoughtfully, these tools can help small businesses produce better marketing content faster without needing a large team.

4. Search Visibility and SEO Monitoring
Category: Data and Content and Experience

Search visibility is one of the most important long-term marketing channels for many businesses. Appearing in search results allows potential customers to discover your website while actively looking for information, products, or services.

The foundation for understanding search performance should begin with Google Search Console. Although it was mentioned earlier as part of the analytics ecosystem, it plays a critical role in SEO. Search Console shows which queries bring people to your website, which pages appear in search results, and whether Google is encountering technical issues indexing your content.

Beyond Search Console, many marketers use additional SEO platforms to monitor rankings, research keywords, or analyze competitors. Tools such as Semrush, Ahrefs, and others provide powerful capabilities, although they often come with higher monthly costs. For smaller businesses experimenting with SEO tools, platforms that occasionally appear through AppSumo deals can provide a lower-cost way to test capabilities like keyword monitoring, site audits, or backlink analysis.

While the fundamentals of SEO have not changed, the discovery landscape is evolving. Search engines increasingly include AI-generated answers in results, and large language models are becoming another way users discover information. This shift has introduced concepts such as Answer Engine Optimization (AEO) and Generative Engine Optimization (GEO), where content may appear in AI summaries rather than only through traditional search rankings.

At its core, however, the principle remains the same: understand your customer’s questions and create content that genuinely helps solve their problem.

5. Email Marketing and Communication Platforms
Category: Social and Relationships

Email remains one of the most widely used marketing channels for businesses of all sizes. As soon as a company launches a website or begins collecting customer information, email quickly becomes an important way to communicate with prospects and customers.

Email platforms allow businesses to send newsletters, product updates, announcements, and other communications directly to their audience. Many tools also support basic automation such as welcome emails, follow-up messages, and simple customer nurturing campaigns.

For businesses that sell products online, email often plays an even larger role. eCommerce platforms frequently use email to send order confirmations, shipping updates, abandoned cart reminders, and promotional campaigns designed to encourage repeat purchases.

Popular platforms include services such as Mailchimp, HubSpot, Constant Contact, and others. The right choice often depends on the size of the business, how integrated email needs to be with a CRM system, and whether more advanced automation is required.

For many small businesses, email becomes one of the earliest and most reliable ways to stay connected with customers and build long-term relationships.

6. Paid Search and Digital Advertising
Category: Advertising and Promotion

While organic search can generate long-term visibility, paid advertising allows businesses to reach potential customers more quickly. Platforms such as Google Ads and Microsoft Ads allow businesses to display ads when users search for specific keywords related to their products or services.

Most advertising platforms are free to use from a software perspective, but businesses pay when users click on their ads. This pay-per-click model allows marketers to control budgets while measuring how advertising contributes to website traffic and conversions.

Because paid campaigns can become expensive quickly, many businesses eventually explore tools that help monitor performance, optimize campaigns, or identify wasted spend. Some tools focus on improving ad performance through bid adjustments and keyword insights, while others help detect fraudulent or low-quality clicks that may drain advertising budgets.

For many small businesses, however, the most important step is simply understanding how paid search works and starting with carefully managed campaigns before adding additional optimization tools.

7. Privacy and Consent Management: Consently
Category: Management

As websites collect more data through analytics, advertising, and other tracking technologies, privacy and consent management have become an increasingly important part of the marketing stack.

Many jurisdictions now require websites to inform visitors about cookies and tracking technologies and, in some cases, obtain consent before collecting certain types of data. Regulations such as GDPR and other privacy frameworks have made compliance an important consideration for businesses operating online.

Consent management platforms help address this challenge by scanning websites for cookies, generating privacy policies, and providing visitors with clear options for managing their data preferences.

Tools like Consently can help businesses monitor cookies running across their website, generate privacy documentation, and maintain records of visitor consent. For small businesses, these tools can simplify an area of marketing that is often overlooked but increasingly important.

Even when regulations do not strictly apply, being transparent about data collection and privacy practices helps build trust with website visitors.

Other Martech Categories Worth Considering

The stack above focuses on the foundational tools that help small businesses build a website, measure marketing performance, create content, and generate visibility.

However, other categories within Brinker’s martech framework may become important as a business grows.

For example, most organizations will have a Customer Relationship Management (CRM) platform to track leads, manage customer relationships, and support sales activity. CRM decisions often involve multiple departments including sales, leadership, and finance, which is why they were not explored in detail here. Platforms such as Salesforce and HubSpot are among the most widely used in this category.

There are also additional optimization tools that some businesses explore, such as heatmaps, behavior analytics, and A/B testing platforms. These tools can provide insight into how visitors interact with web pages and how design or messaging changes influence behavior. However, many smaller websites may not receive enough traffic to run statistically meaningful A/B tests, which is why simpler behavior insights are often more practical early on.

The goal of a practical martech stack is not to include every possible tool. It is to start with a small set of platforms that provide real visibility into marketing performance and expand the stack only when a clear need appears.

A Practical Martech Stack for Small Businesses Read More »