Marketers serious about understanding their customers can’t afford to treat surveys as a checkbox. Whether it’s Net Promoter Score (NPS), Customer Satisfaction (CSAT), or broader Voice of Customer (VoC) programs, survey data should inform strategy — not just sit in a dashboard.
Below are the essential KPIs and stats that reveal how real companies are collecting, using, and acting on customer feedback today. These aren’t vanity numbers — they’re backed by research and chosen for their direct marketing relevance.
“39% of companies don’t regularly ask customers for feedback about their interactions.”
That’s nearly 4 in 10 businesses missing a crucial opportunity to listen and improve — a competitive disadvantage in today’s market.
“NPS fell significantly for the majority of industries for both countries. NPS improved for only one industry in each country: airlines in the US and luxury auto manufacturing in Canada.”
Most industries saw flat or falling NPS, indicating it’s harder to gain loyal customers today without focused CX efforts.
“Organizations that demonstrate how customer satisfaction is associated with growth, margin and profitability are more likely to report customer experience success and are 29% more likely to secure more CX budgets.”
Measuring and communicating NPS/CSAT impact on the bottom line helps justify resources for VoC initiatives.
“NPS scores provide a snapshot of your overall customer experience; if customers are more likely to recommend your business, that naturally points to a high level of customer satisfaction and a positive customer journey.”
Marketers should compare their score to relevant industry norms.
“Promoters are significantly more likely than passives or detractors to exhibit all three key loyalty behaviors: purchasing more, trusting the company to take care of their needs, and forgiving the company if it makes a mistake.”
Converting a detractor into a promoter has far greater revenue impact in some industries.
Market segmentation is the practice of dividing a broad market into smaller groups of consumers who share similar characteristics, needs, or behaviors. In other words, not all consumers are your customers – segmentation identifies those sub-markets where people are more likely to buy your product or service. By splitting a large “pie” (the total market) into meaningful slices, companies can design tailored products and messages for each group, rather than using one-size-fits-all marketing.
Why does this matter? A clear segmentation strategy makes marketing far more effective and efficient. Think of it like archery: hitting a bullseye requires focusing on the right spot. In marketing terms, segments let you aim your campaigns at the precise group most likely to respond, instead of scattering resources on everyone.
More efficient spending: By concentrating on relevant customer segments, companies avoid wasting ad budget on disinterested audiences. Campaigns tailored to each segment tend to have higher response rates because the message directly addresses that group’s needs.
Stronger engagement and loyalty: Targeted marketing resonates more deeply. Research shows segmentation often leads to better customer experiences and loyalty because people feel understood. Instead of generic pitches, marketers can speak each segment’s “language” about the things they care about.
Higher profits: Industry studies back up these advantages. For example, a Bain & Company survey found 81% of executives said segmentation was crucial for profit growth, and companies with strong segmentation strategies enjoyed about 10% higher profits over five years.
Competitive edge: In a crowded marketplace, a well-segmented approach can be a differentiator. When customers see that a brand’s ads and products match their specific lifestyle or needs, they’re more likely to respond.
In summary, segmentation aligns marketing with customer reality. Rather than firing marketing messages at the whole “wall” of the market (where most arrows miss), segmentation focuses each “arrow” on the right cluster of consumers. This alignment drives better engagement, higher ROI, and business growth.
Major Segmentation Types
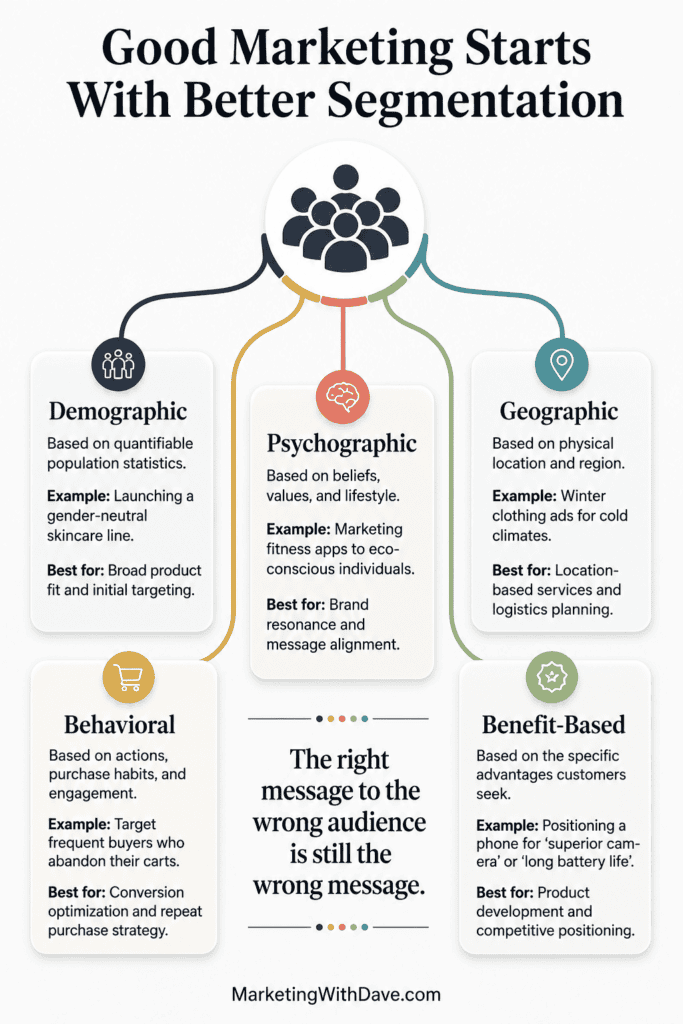
Marketers commonly segment markets using five broad bases. Each base slices the audience in a different way:
1. Demographic Segmentation
Groups consumers by objective attributes like age, gender, income, education, occupation, marital status, or family size. For example, a luxury car company might target the high-income professionals segment, while a toy manufacturer focuses on the families with young children segment. Demographics are easy to measure (everyone has an age or income), so it’s simple to gather data and analyze. However, demographic segments can be broad and may not capture why people buy – two people with the same age and income might have very different tastes.
2. Geographic Segmentation
Divides the market by location such as country, region, city, or climate. The idea is “people in different places have different tastes or needs,” so brands tailor products to local preferences. For instance, McDonald’s famously adjusts its menu by country – offering a McAloo Tikki (potato burger) in India and a Teriyaki Chicken Sandwich in Japan. Geographic segmentation is straightforward and can capture cultural or climate-driven differences, but it assumes homogeneity within regions. It may miss individual differences (not everyone in a region behaves alike) and can be too coarse if the product is global in nature.
3. Psychographic Segmentation
Splits consumers by lifestyle, values, attitudes, interests, or personality traits. It goes deeper than demographics by asking why people buy. For example, outdoor apparel brand Patagonia targets consumers who value environmental sustainability and adventure. Psychographic segments allow highly relevant messaging (“We share your eco-values”) and can explain motivations, but they are harder to measure and require qualitative research (surveys, interviews) to identify. Data on people’s beliefs or hobbies is not as readily available as demographic data, so psychographic segmentation often involves more investment.
4. Behavioral Segmentation
Categorizes consumers by their behaviors or interactions with the product/service. This includes purchase history, brand loyalty, usage rate, or purchase occasion. For example, e-commerce sites often retarget users who abandoned items in their shopping cart – that segment (users who added to cart but didn’t buy) is behaving differently and gets its own targeted ads. Behavioral segments are useful because they are directly tied to actions (you know someone’s already interested in a product). They allow precise targeting (e.g. frequent vs infrequent buyers), but require detailed data collection and analysis (not all businesses have easy access to such data). Also, behavior can change over time (someone may be a new buyer one month and a loyal customer the next), so segments may need frequent updating.
5. Benefit-Based Segmentation
Groups customers by the specific benefits or value they seek from the product. Here the focus is on what consumers want to achieve. For example, in the shampoo market, one segment may primarily seek anti-dandruff benefits while another cares about color-protection or hydration. Marketers identify these benefit segments by asking customers their needs or by observing usage patterns. Benefit segmentation directly ties to product development: each segment’s needs can shape product features or messaging. The upside is highly relevant marketing (“Our toothpaste whitens your smile” vs. “Our toothpaste strengthens enamel”). The downside is that benefits can overlap and are harder to quantify; it usually takes market research to discover the distinct benefits consumers seek.
To summarize, each segmentation base offers a different lens. In practice, companies often use combinations (for example, demographic + psychographic) to create more refined segments. The key is that each chosen segment should be internally similar and distinct from other segments.
Comparing Segmentation Types
The comparison below examines the common segmentation bases, with examples and typical pros/cons for each:
Demographic Segmentation
Focus/Example: Group by attributes (age, income, gender, etc.). Example: Luxury cars for high-income professionals.
Pros: Easy to measure (census, surveys). Broad data availability. Simple to implement.
Cons: May overlook attitudes or needs. Broad segments; low insight into motivations.
Geographic Segmentation
Focus/Example: Group by location (country, climate, region). Example: McDonald’s adapting menus to local tastes (India vs. Japan).
Pros: Captures regional/cultural preferences. Useful for physical distribution or local laws.
Cons: Assumes uniformity within regions. May ignore individual differences across regions.
Psychographic Segmentation
Focus/Example: Group by lifestyle and values. Example: Patagonia appeals to eco-conscious outdoor enthusiasts.
Pros: Deep insights into customer motivations. Enables highly tailored emotional messaging.
Cons: Harder and costlier to research and quantify. Requires surveys or interviews to gather data.
Behavioral Segmentation
Focus/Example: Group by user actions or usage patterns. Example: Online shoppers retargeted after cart abandonment.
Pros: Directly tied to actual purchase behavior. Can target based on loyalty, occasion, usage.
Cons: Data-intensive: needs tracking systems. Behavior can shift over time (requires updates).
Benefit-Based Segmentation
Focus/Example: Group by benefits sought from product. Example: Shampoo buyers segment by desire for volume vs. for color-protection.
Pros: Focuses on why customers buy, guiding product design. Creates clear value propositions.
Cons: Segments can overlap (someone wants multiple benefits). Hard to identify without customer research.
Each approach can be powerful when applied to the right product. Demographic and geographic segments are relatively easy to identify with existing data, making them common first steps. Psychographic and behavioral segments typically yield richer targeting but need more effort to develop. Benefit segmentation is especially useful for product strategy, as it directly links marketing to customer needs.
Segmentation Frameworks and Criteria
To create effective segments, marketers follow structured frameworks. A classic guideline is that each segment should satisfy five criteria: it must be Accessible, Differentiable, Actionable, Measurable, and Substantial. In practice, this means:
Accessible: The company must be able to reach and serve the segment through communication or distribution channels. Can the marketing team affordably contact these customers?
Differentiable: The segment should be clearly distinct in its response or needs. In other words, customers within a segment should be similar to each other but meaningfully different from other segments. This ensures one marketing program won’t blur into another.
Actionable: The segment can be targeted with a practical marketing strategy. It should be possible to design specific promotions or products for this segment and expect measurable outcomes.
Measurable: The segment’s size and purchasing power can be estimated quantitatively. For example, we should be able to approximate “there are 10,000 people in this segment in our market and they spend $X.” This determines if it’s worth pursuing.
Substantial: The segment is large enough and profitable enough to justify the resources. It should represent a meaningful share of the market (not just a handful of niche consumers).
Together these criteria (sometimes abbreviated ADMAS) help filter out impractical segmentation schemes. If a proposed segment is too small, too hard to measure, or unreachable, it likely won’t support a viable marketing program.
Segmentation Models and Tools
Beyond these criteria, there are formal models to guide segmentation. For psychographic segmentation, the VALS framework (Values and Lifestyles) is a well-known system that classifies U.S. consumers into lifestyle types. For B2B markets, firmographic segmentation (by company size, industry, etc.) plays the role that demographics play in consumer markets.
Data-driven methods are also common: for example, cluster analysis (e.g. K-means clustering) can uncover natural segments from customer data. E-commerce firms often use RFM analysis (segmenting by recency, frequency, monetary value of purchases).
Ultimately, these frameworks ensure segments are grounded in real differences. Industry best practices emphasize that segments must be actionable and meaningful. By following segmentation models and checking against standard criteria, marketers increase the chances of finding the right segments – those they can actually target effectively.
Explaining Segmentation with Metaphors
For beginners, it helps to use visual metaphors to grasp segmentation:
Slicing a pie or cake: Imagine the whole market as a giant pie. Segmentation means cutting the pie into slices by different flavors or ingredients. Each slice goes to a group that “likes” that flavor. This way, you serve each person a piece they want, rather than giving everyone the same combination.
Sorting fruit into baskets: Think of a mix of apples, oranges, and bananas. If you market fruit snacks, you wouldn’t treat all fruit lovers the same. You might sort by type – put apples in one basket (segment), oranges in another. Then you can tailor messages (“Our snack has the sweet crunch you crave” for apple lovers vs “Our tropical citrus bites” for orange lovers).
Inviting the right guests to a party: Segmentation is like curating your guest list. You don’t invite everyone in town—you invite those whose tastes match the meal and the conversation. Marketing works the same way: curate your audience.
Hitting the bullseye: Rather than randomly firing arrows, segmentation helps you aim accurately at the right target audience. Each arrow (ad) hits closer to the bullseye (ideal customer) because you’ve narrowed down the aim.
These metaphors illustrate the core idea: don’t try to please the entire market at once. Instead, break it into groups (slices, baskets, guest lists, targets) and tailor your approach so that each group’s specific tastes and needs are met. This visual thinking makes it clear why segmentation prevents wasted effort and enhances resonance with customers.
How to Start Segmenting Your Audience
To put segmentation into practice, marketers can follow a step-by-step process:
Define the overall market: Identify your total addressable market and ensure there is enough need for your offering. Ask: Is this market large enough? What core problem are you solving?
Choose segmentation variables: Decide which bases (demographic, geographic, psychographic, behavioral, benefit) are relevant to your business. Often, a combination works best. For example, a company might segment by both age group and by purchase occasion. Experiment with different criteria to find meaningful groups.
Gather and research data: Collect data to profile customers on those variables. This might involve analyzing sales records, website analytics, or customer surveys. Use both quantitative data (e.g. purchase history, survey ratings) and qualitative insights (e.g. focus groups, interviews). Ask customers about their preferences, needs, and lifestyle to uncover patterns.
Analyze to form segments: Use the data to identify clusters of customers who share characteristics. Statistical methods (like cluster analysis) can help, but even cross-tabulating key variables may reveal segments. For each potential segment, check the criteria from above (measurable, substantial, etc.). Create clear segment profiles (e.g. “Tech-savvy urban millennials who shop online weekly”).
Test and refine: Develop tailored marketing messages or small campaigns for each segment and measure the response. For example, send a targeted email offer to one segment and compare its conversion rate to that of a general campaign. Use A/B testing or pilot launches. If a segment doesn’t respond as expected, revisit your data or consider splitting it into sub-segments. Continuously refine the segmentation: markets change, so update segments periodically.
By following these steps – defining the market, selecting bases, researching customers, creating segments, and testing – marketers can build actionable segments. Over time, this process will inform product development, channel strategy, and messaging for each group. It’s a cyclical strategy: revisit your segments when market conditions shift (for instance, after a big trend or annually).
Actionable Advice:
Start small. You might begin with one or two key variables that you suspect are important for your business (e.g. age and buying frequency). Use your existing data or conduct a quick survey. Even informal segmentation (like grouping customers by their main complaint or favorite feature) can yield insights. The goal is to move from “everyone” to “these two or three groups” as the focus of your next campaign. Then learn and expand from there.
In Summary
Marketing segmentation is about recognizing that not all consumers are the same. By dividing your market into well-defined groups (based on demographics, location, lifestyle, behavior, or sought benefits) and applying disciplined frameworks to create effective segments, you enable highly targeted, efficient marketing. Proper segmentation drives better customer engagement, higher ROI, and ultimately stronger business results.
Customer satisfaction surveys are only as valuable as the insights you extract from them. While raw response data offers a starting point, visualizing that data—especially when segmented by customer type—can reveal patterns, pain points, and opportunities that might otherwise go unnoticed. In this post, I’ll walk through a series of sample survey questions using fictitious data to demonstrate how visual analysis helps uncover deeper insights.
However, one effective and visually engaging way to represent this type of feedback is by using a word cloud generator. Word clouds highlight frequently used words or phrases by scaling them in size based on how often they appear—offering a quick, compelling snapshot of recurring themes.
Question 1: Customer Type
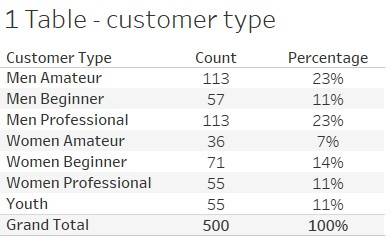
The first question asks, “Please select your customer type from the list below.” While this fictitious data may not be particularly insightful on its own, its true value emerges when combined with responses to other survey questions. The table below shows the count and percentage breakdown for each customer type.
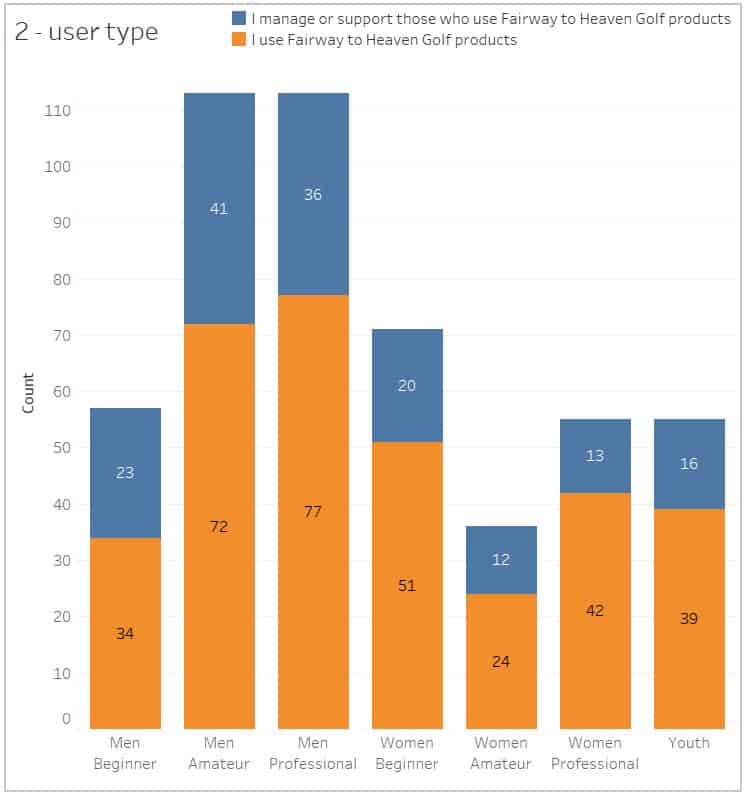
Question 2: User vs. Manager/Support Role
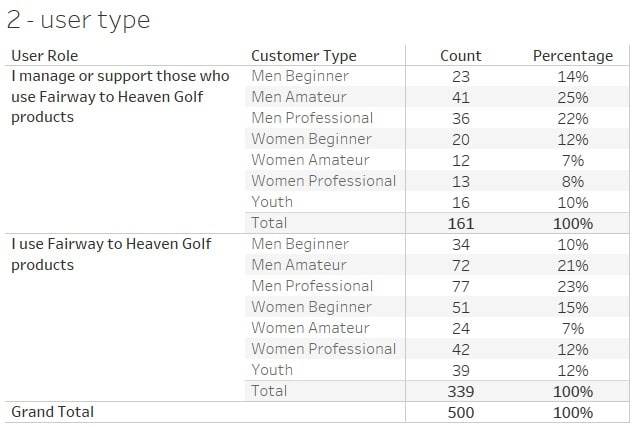
The second question asks, “Which of the following best describes you?” with response options such as “I use X products” or “I manage or support those who use X products.” The graph below presents the results for this question, segmented by the customer types from the previous question. A stacked bar chart (shown below the table) is likely the preferred format, as it clearly illustrates how each customer type breaks down across the two roles. Notably, both Men Amateur and Men Professional include a significant portion of respondents who don’t directly use golf equipment but represent a valuable, distinct segment—one that warrants personalized targeting due to their influence and unique needs.
Question 3: Likelihood to Continue
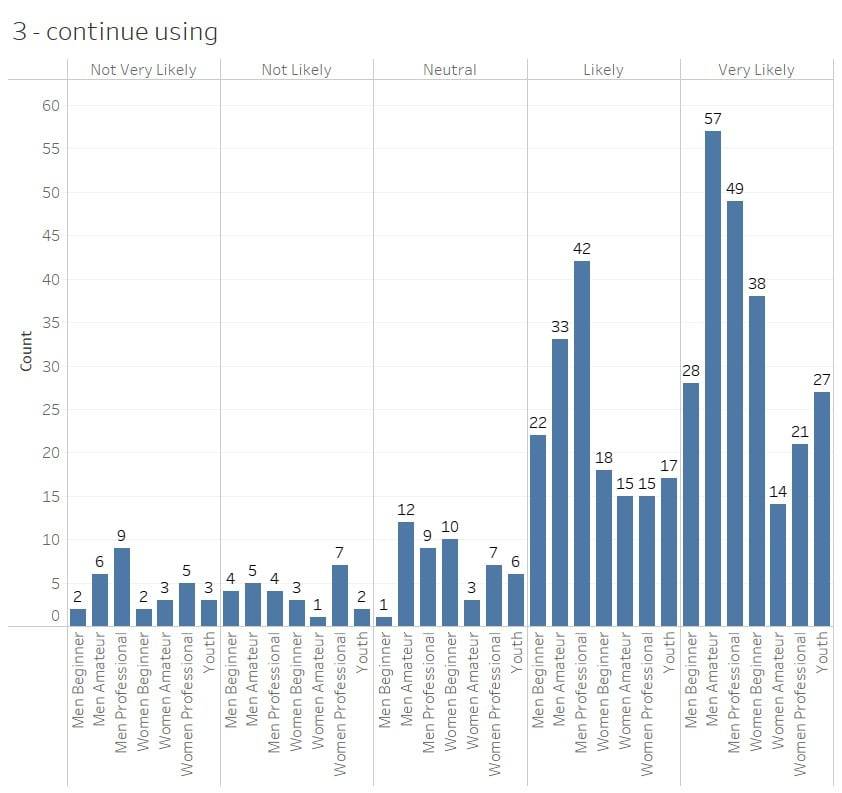
The third question asks, “How likely are you to continue using our products and services?” In our example data, the Men Amateur segment stands out—they are both the largest group selecting Very Likely to continue and the largest group choosing Not Very Likely, Not Likely, and Neutral. While this is only sample data, it illustrates how this type of chart can surface important patterns and contradictions within segments—offering deeper insights than overall averages alone.
Question 4: Product Satisfaction
The fourth question asks, “Overall, how satisfied are you with the following [company] products?” Responses were captured on a five-point satisfaction scale. To support analysis, we translated these into a numeric scale, assigning 5 to Very Satisfied and 1 to Not Very Satisfied. This approach makes it easy to identify patterns—such as the Men Professional segment showing the lowest satisfaction scores for drivers. This could indicate the equipment isn’t meeting their performance expectations, perhaps lacking the stiffness or control they require. Either way, it’s a signal worth investigating further.
Question 5: Service Satisfaction
The fifth question, similar to the previous one, shifts the focus from products to services and asks, “Overall, how satisfied are you with the following [company] services?” As before, responses were converted to a numeric scale ranging from 1 (Not Very Satisfied) to 5 (Very Satisfied). In this example, the Women Professional segment reports the lowest satisfaction with speed of play. One possible explanation is that this group, likely teeing off from the forward (red) tees, may still have to wait for the group ahead to clear out of their driving range—leading to delays that impact their overall experience. This insight suggests an opportunity to explore pace-of-play improvements or better course flow accommodations for this segment.
Question 6: Ease of Doing Business
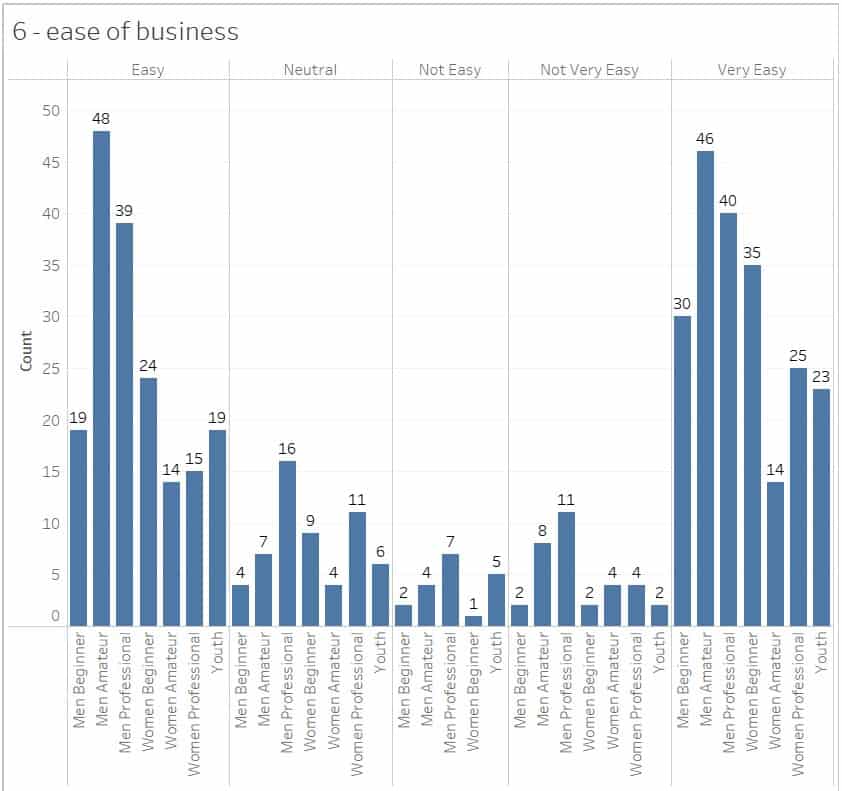
The sixth and final question asks, “Overall, how easy is it to do business with [company]?” The Men Professional segment stands out, with the highest number of responses in the Not Very Easy, Not Easy, and Neutral categories. This suggests that, for this group, the customer experience may be falling short.
Conclusion: Turning Visual Insights Into Action
Visualizing your customer satisfaction survey data is more than a reporting exercise—it’s a critical step toward understanding your audience, segmenting with intent, and prioritizing actions that improve loyalty and retention. From identifying product dissatisfaction among advanced users to uncovering hidden friction points in the customer journey, these visualizations offer strategic leverage.
As you review your own survey data, segment by customer type, look for outliers, and focus on translating findings into experiments. What can you fix, enhance, or personalize? That’s where the real value of survey data lies—not in collecting it, but in acting on it.
“Segmentation is not always the answer. It is only useful when it adds value.”
“No algorithm can compensate for poor data quality or ill-defined segmentation goals.”
“Market segmentation is not just a statistical exercise — it is a strategic decision-making process.”
Book Theme
Marketing Segmentation Analysis covers how to understand, perform, and apply market segmentation using both managerial and statistical perspectives — with an emphasis on replicable analysis using R.
Why You Should Read This Book
Bridges the gap between marketing strategy and data science.
Offers a replicable 10-step framework.
Includes real-world datasets and R code.
Improves targeting, resource allocation, and customer satisfaction.
Perfect for cross-functional marketing teams.
Key Ideas or Arguments
Segmentation adds strategic clarity.
10-step framework covers the full lifecycle.
Uses relatable tourism examples.
Combines theory with execution.
Emphasizes data-driven approaches.
Stresses the importance of good data.
Powered by R for transparency.
Segmentation isn’t always necessary.
Visual communication is crucial.
Segments must evolve over time.
Book Outline
Part I: Introduction
Market Segmentation
Market Segmentation Analysis
Part II: 10 Steps (from deciding to segment to evaluating results)
Step 1: Deciding (not) to Segment
Step 2: Specifying the Ideal Target Segment
Step 3: Collecting Data
Step 4: Exploring Data
Step 5: Extracting Segments
Step 6: Profiling Segments
Step 7: Describing Segments
Step 8: Selecting the Target Segment(s)
Step 9: Customizing the Marketing Mix
Step 10: Evaluating and Monitoring
Appendices: Case Studies, R, Datasets
Key Takeaways
10-step segmentation framework
Distance-based & model-based clustering
Biclustering & stability diagnostics
Data visualization techniques
R packages: MSA, flexclust, flexmix, mclust
Author’s Qualifications
Sara Dolnicar (University of Queensland)
Bettina Grün (Johannes Kepler University Linz)
Friedrich Leisch (University of Natural Resources and Life Sciences, Vienna)
Comparison to Similar Books
More replicable and statistically grounded than traditional marketing texts. Uniquely open-source and application-focused.
Target Audience Groups
Marketing analysts and data scientists
Strategists and CMOs
Academics and students
Tourism professionals
Market researchers and R users
Critical Response to Book
Praised for making segmentation transparent and practical. Adopted widely in education and professional settings.
One Sentence Takeaway
Market segmentation only delivers value when it’s purposefully designed, properly executed, and continuously refined to inform better marketing decisions.
Personalization isn’t optional anymore — it’s expected. With today’s technology, customers anticipate that brands will know who they are, what they like, and how to speak to them personally.
So, why isn’t everyone doing it well? It’s not a lack of tools or even a lack of effort. Often, the real barrier is a lack of trust in the data. Some marketers don’t know better. Some don’t care. But most simply don’t trust that their data is accurate enough to personalize confidently.
How to Build Data Trust
Data Governance: Set clear policies on how data is collected, updated, and used across departments.
Regular Audits: Schedule quarterly database audits to check for missing, duplicate, or outdated records.
Transparency with Customers: Be open about what data you collect and why — builds long-term loyalty.
Internal Training: Educate your teams on the importance of good data practices to avoid accidental decay or misuse.
Level
Personalization Approach
Key Actions
KPIs to Watch
Common Pitfalls
Good
Use basic customer data like first names in communications.
Audit database accuracy
Use fallback values for missing data
Personalize subject lines and greetings
Email open rate increase (aim for 10–20% lift with basic personalization)
Leverage behavioral, demographic, and interest-based personalization.
Segment by behavior and demographics
Trigger communications based on actions
Test dynamic content in emails and web pages
CTR (Click-Through Rate) increase by 50–100% with segmented campaigns
Over-segmenting into too small groups, Assuming demographics alone predict intent
Best
Deliver true 1:1 personalization based on complete customer profiles and predictive modeling.
Integrate CRM/CDP to unify data
Use machine learning for recommendations
Automate real-time behavior-triggered messaging
20%+ increase in customer lifetime value through predictive personalization
Personalization that feels invasive (“creepy” factor), Failure to update models regularly
The good news? Personalization is a maturity journey — not a one-time switch you flip. In this post, we’ll walk through a simple Good, Better, Best framework to assess where you are today and what you can do to move forward.
Level 1: Good
At the most basic level, personalization means inserting simple information like a first name into your marketing communications. Think about emails that start with “Dear {First Name}” — you’ve probably received hundreds of them.
Is this really good personalization? Not quite. But if you’re doing it, you’re already on the right path. Using basic data like first names signals that you’re beginning to organize and structure your customer information in a usable way. It’s far better than no personalization at all — and it sets the foundation for deeper efforts later.
Actionable Tips for Good Personalization:
Audit your database for completeness and accuracy (especially first names).
Use fallback values for missing data (e.g., “Hi there” instead of “Hi {First Name}”).
Test placement of personalization — subject lines, greetings, or body copy — to see what resonates most.
Level 2: Better
The next level of personalization moves beyond surface details and taps into customer behaviors, interests, and demographic signals. Instead of only knowing who they are, you start using clues about what they want.
There’s no one perfect data point — the key is to experiment and learn what types of personalization resonate best with your audience.
Examples of Better Personalization:
Targeting based on generational cohorts (e.g., Millennials, Gen Z).
Triggering communications based on website behavior (e.g., downloaded a PDF, viewed a product).
Tailoring offers based on known interests (e.g., outdoor enthusiasts, tech lovers).
Actionable Tips for Better Personalization:
Use tracking tools (like Google Analytics events) to capture behavioral data.
Segment email lists by both demographic and behavioral traits.
Test dynamic content blocks in emails or on landing pages based on audience attributes.
Level 3: Best
At the highest level, personalization becomes truly individualized — delivering 1:1 experiences at scale. This isn’t a marketing unicorn anymore; it’s entirely achievable if you have trusted, integrated data systems and a commitment to customer-centric marketing.
True 1:1 personalization means that each customer receives content, offers, and messaging uniquely relevant to them based on a full view of their history, preferences, and behaviors.
Examples of Best Personalization:
Product recommendations based on purchase and browsing history.
Dynamic web experiences personalized to individual user profiles.
Automated lifecycle communications tied directly to individual behaviors (e.g., abandoned cart reminders customized by product category and past purchase behavior).
Actionable Tips for Best Personalization:
Invest in a robust CRM or CDP (Customer Data Platform) to unify data sources.
Use machine learning models to predict customer needs and automate recommendations.
Prioritize data quality initiatives to maintain trusted, actionable insights.
Set up triggered messaging workflows that respond to individual behaviors in real time.
Conclusion
Personalization isn’t about perfection — it’s about progress. Whether you’re just starting with basic details or you’re already tailoring full 1:1 experiences, each step forward builds stronger connections with your audience. Focus on moving from Good to Better to Best, and you’ll create marketing that feels less like noise — and more like a true conversation with your customers.
PRIZM® Premier by Claritas is a powerful lifestyle segmentation tool that helps digital marketers understand and target audiences based on demographic, behavioral, and geographic data.
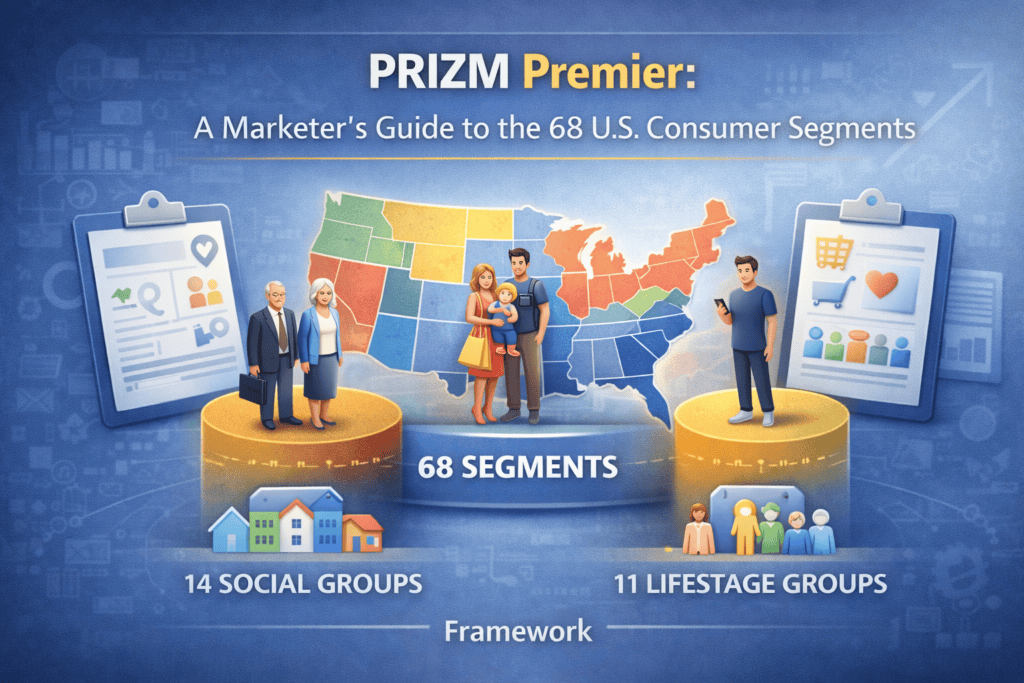
It classifies every U.S. household into one of 68 distinct segments, grouped into 14 Social Groups and 11 Lifestage Groups.
Why It Matters for Marketers
Improve audience targeting with lifestyle and geographic overlays.
Personalize messaging and creative to fit segment-specific preferences.
Refine media mix and channels using insights about digital behavior.
Optimize budget allocation based on segment performance.
Layer PRIZM on CRM data for segmentation, lookalike modeling, and retention.
PRIZM Social and Lifestage Groups
Social Groups (14)
Defined by urbanicity and affluence.
Urban Uptown
Midtown Mix
Urban Cores
Second City Society
City Centers
Metro Mix
Connected Bohemia
Comfortable Country
Country Comfort
Rural Resorts
Rustic Living
Simple Pleasures
Middle America
Small Town Charm
Lifestage Groups (11)
Defined by age, income, and presence of children.
Youth & Transition
Midlife Success
Mature Years
Young Achievers
Young Families
Midscale Families
Family Life
Active Adults
Wealthy Empty Nests
Midlife Stability
Retirement Communities
Use the Claritas ZIP Code Look-Up tool to view the lifestage or social group for a given area, along with data on household income, composition, age distribution, and racial and ethnic demographics.