There has been plenty of emotions leading up to Google Analytics 4 or GA4 being released and the increased pressure to make sure we are each ready. I finally decided to try to make sense of Google Universal Analytics and GA4 and here were my key notes in case others find this helpful.
Dates – Universal Analytics (UA) deprecated July 2023 and UA 360 now deprecated October 2023.
Users – same term used in GA4 but it means active users instead of total users.
Model – UA is session-based (a session was a group of user interactions) where GA4 is an event-based model.
Engaged Session is the count of sessions that lasted longer than 10 seconds, or had a conversion event, or had two or more screen/page views. This will replace the pages per session metric.
Average Engagement Time Per Session is the amount of time the user is actually engaging with the page and is the page on the primary window being viewed on screen. This will replace the average session duration metric.
Engagement Rate is the ratio of engaged sessions relative to total sessions. This will replace the bounce rate metric although it can still be calculated as the inverse of the engagement rate. 100 total sessions with 15 of them being engaged sessions results in a 15% engagement rate.
Four Categories of Events a. Automatically collected events like user engagement, in-app purchases, and Firebase app interactions. b. Enhanced measurement events (change in user interface; no code changes required) like page views, scrolls, form interactions, and video engagements. c. Recommended events that have predefined names and parameters like online sales and user behavior. d. Custom events that you define and create when existing events don’t exist.
Segments – both in UA and GA4 you can compare up to four segments. Types of segments in GA4: a. User segments – subsets of users who engaged with your site/app like users from a page or channel. b. Event segments – subsets of events that were triggered on your site/app like purchase events. c. Session segments – subsets of the sessions that occurred on your site/app like a particular advertising campaign.
Segmentation Conditions tell analytics what data to include in or exclude from the segment. There are three segmentation conditions: a. Dimension conditions like demographics, geography, and technology. b. Event conditions about particular details on one or more events. This is new to GA4. c. Metric conditions based on predictive metrics like an in-app purchase probability is above the 90th percentile.
Attribution Modeling is assigning credit for conversions to different ads, clicks, and other factors. There are three types of attribution models available in the Attribution reports: a. Cross-channel rules-based model ignores direct traffic and attributes 100% of conversion value to the last channel that the customer clicked through or engaged view through for YouTube before converting. Other cross-channel rules-based models include: i. Cross-channel first click – all conversion credit to first channel that a customer clicked. ii. Cross-channel position based – attributes 40% credit to first and last interaction and remaining 20% credit distributed evenly to middle interactions. iii. Cross-channel linear – distributes credit for conversion equally across all channels a customer clicks. iv. Cross-channel time decay – gives more credit to touchpoints that happened closer to time of conversion. Uses a 7-day half life so a click 8 days before conversion gets half the credit of a click 1 day before a conversion. b. Ads-preferred rules-based model – attributes 100% conversion value to the last Google Ads channel that the customer clicked before converting. If there is no Google Ads click, attribution model falls back to cross-channel last click. c. Data driven attribution – uses machine learning algorithms to evaluate converting and non-converting paths. Distributes credit for the conversion based on your account data for each conversion event.
As of this writing, it looks like males are only accounting for 15% of users. I don’t think there is another primary social media platform that is so heavily slanted to one gender. Perhaps I am more prone than most to use Pinterest since I have three girls and try to keep up on their world. Wait…it’s time to BeReal. Sorry, where was I? Along with Disney princesses, Taylor Swift, and now Shein, I have my digital pulse on the female teenager.
Every social media platform is gamified in some way to motivate you to get more of something. Reminds me of the old Drink Pepsi, Get Stuff campaign of the 90s. I don’t even think we care what the stuff is. Facebook has friends, Twitter has tweets, and Instagram has likes. What does Pinterest have? Pins of course, and there is absolutely nothing wrong with that.
But, wouldn’t you love to know, share, and brag about how many total times your pins were shared? Sure, down the road, show our top 10 pins or our top pin by board. But for now, let’s give the people what they want and let them see their total SHARED PINS.
I love the Oliver Stone directed movie Wall Street that stars Michael Douglas with Charlie Sheen and his dad Martin Sheen. It’s rating on IMDb is a 7.3 and I gave it a 9. The acting is so good you fall in love with the characters and forget they are portraying terrible people doing horrible things.
As a digital marketer, there can be a fine line between promoting a product or service because it’s good for the company rather than good for the customer. True joy in life or in marketing comes from helping others. Although Wall Street is a product of Hollywood, the portrayal of illegal insider trading, greed that is unquenchable, and man’s inhumanity to man seems less shocking in today’s calloused world.
Wall Street was released in 1987 before we had the internet and digital marketing was just marketing. Unless you lived it, you wouldn’t believe the sophistication we now enjoy with technology over these decades. One example is the very, very brief scene where the 1985 Market Projections bar chart was shared. I of course had to pause the movie to zoom in on the details which I included in this post.
This bar chart was obviously not intended to be truly seen, let alone analyzed but let’s do it anyway.
The X or horizontal axis obviously just has placeholder names for these markets, X, XX, and XXX. Each of these three markets has four different measurement but there is no way to know what those are.
The Y or vertical axis ranges from 0 to 350. Best practice would say to show the 0 and to know what is this measurement, likely dollars but should this also be in thousands?
For a movie made in 1987, why would we be seeing 1985 market projections given that projections are about the future.
Whatever this X, XX, and XXX is that has four different bar graphs, it’s possible if we knew what this data was, a line chart would make better sense. I guess this will remain one of Hollywood’s secrets.
Bottom line, if you haven’t seen Wall Street, do it. Also, be a better human. There is enough suffering in the world and your kindness and selflessness could be answer to someone’s prayer.
I think the best teacher is experience. Or said another way by Alfred Einstein, the only source of knowledge is experience. Experience is to credit for these tips in improving your customer satisfaction survey. I hope my experience can add to your knowledge.
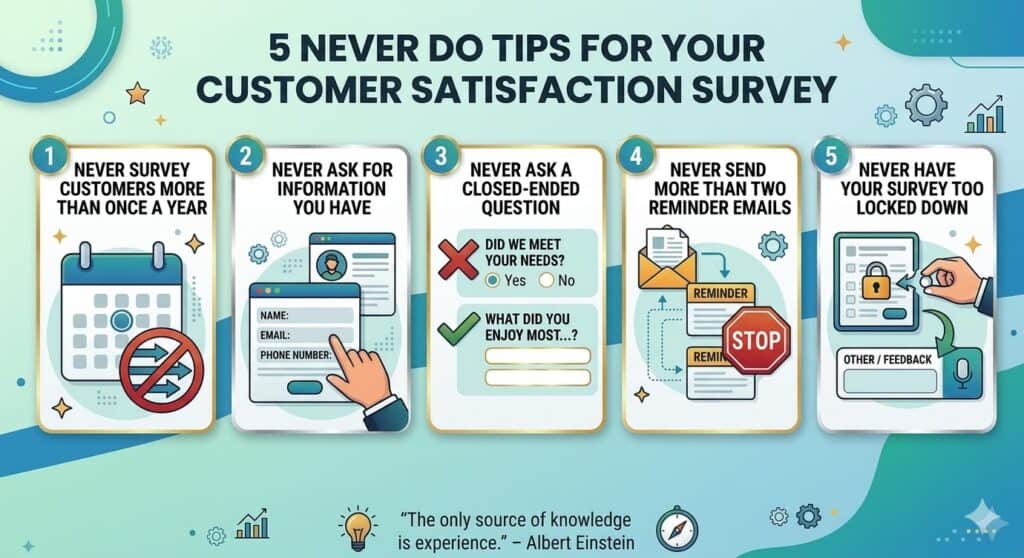
1. Never survey your customers more than once a year
Your customer satisfaction survey should only be sent on an annual basis to each customer. There can certainly be others surveys your customers receive from your company based on onboarding or an interaction with customer service, but even those should be minimal.
So, what if you want that customer feedback on a more frequent basis, perhaps quarterly. Simply segment your customers into four segments (Q1, Q2, Q3, and Q4 for example) and then in January send your survey to your Q1 list and in April send to your Q2 list for example. Now you can get more regular data and only survey each customer once a year.
2. Never ask for information you have
Receiving a customer satisfaction survey should feel like an opportunity to assess and reflect on the relationship with your company. Asking for information you already have like their name or email address damages this relationship and makes you look careless.
Even surveys that want you to believe they are anonymous typically have some backend data tied to your custom survey link to know a bit about you. In today’s world, nothing you do is anonymous.
3. Never ask a closed-ended question
A closed-ended question or one that can be answered with Yes or No should never be asked. That’s lazy question writing and with a tiny more work you can get more valuable data.
For example, instead of asking “Did we meet your needs during our recent customer conference?”, ask “What did you enjoy…” or even a “Please rank in order what you enjoyed most about…”.
4. Never send more than two survey reminder emails
Let’s be honest, no one enjoys filling out a survey and typically those who do want to sing your praises or have an ax to grind. Often, the first reminder email can bring in as many survey responses as the initial email and the second reminder can be clear this is your last call to gather their feedback.
If your survey is resulting in a poor response or even unsubscribes from your mailing list, you are getting valuable feedback – your survey sucks.
5. Never have your survey too locked down
If a customer is willing to start filling out your customer satisfaction survey, they likely already have something in mind they want to share. They will likely entertain you with filling out a few of your questions that benefit you but are not what they want to share. Nothing is more frustrating that completing this survey and never having an opportunity to share that feedback.
With many questions, it can be helpful to have an “Other” option where the customer can provide an open-ended response. A great catch all can be a “Is there anything else you would like to share with us” question or even an opportunity to provide their contact information for further follow up.