Last updated September 2026
A/B testing has a deceptively simple premise: show some visitors Variation A, others Variation B, see which performs better.
Want to estimate this for your own experiment? Use my A/B Test Traffic and Sample Size Calculator to estimate the required sample size and testing time based on your baseline CTR, Minimum Detectable Effect, confidence level, statistical power, and eligible traffic.
The hard part isn’t running the test. It’s deciding when the evidence is strong enough to believe the result, especially on a site that doesn’t generate enormous traffic. Even high-traffic sites run into this, because total website traffic isn’t what determines whether a test is viable. What matters is the traffic that can actually participate in that specific experiment.
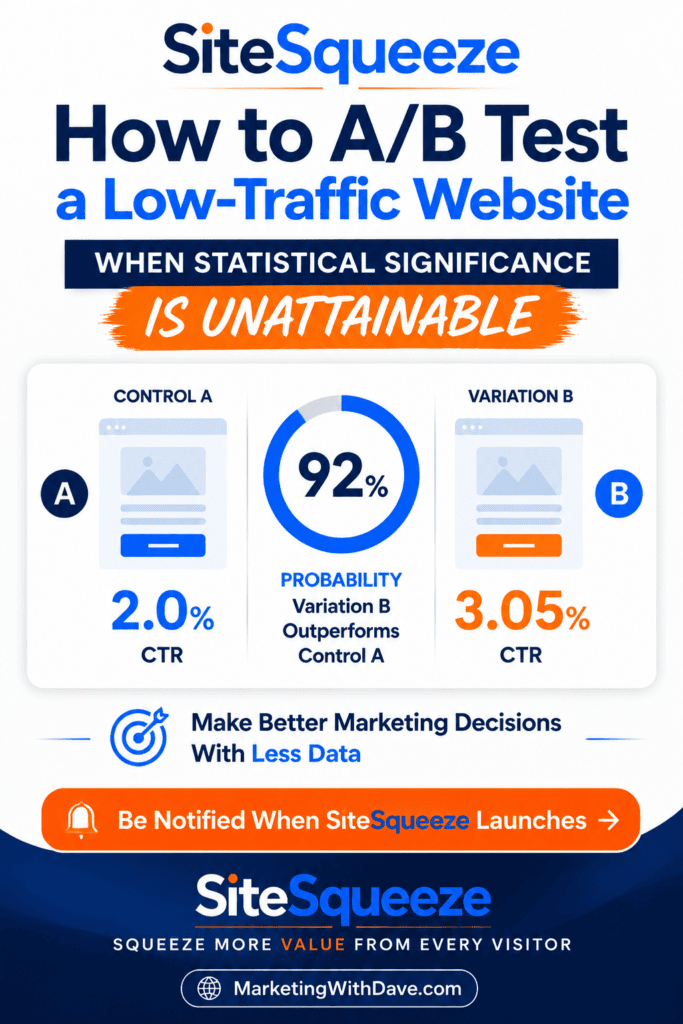
SiteSqueeze’s A/B testing combines Bayesian probability, a user-defined Minimum Meaningful Improvement, a seven-day minimum testing period, and explicit uncertainty states. The goal isn’t to produce a winner as fast as possible. It’s to recommend one only when the evidence actually supports it. Here’s how that works.
Traditional Sample Sizes Add Up Fast
Suppose a promotion has a 2% baseline CTR. Using a conventional fixed-horizon calculation (95% confidence, 80% power, equal allocation), distinguishing a 10% relative lift (2.0% vs. 2.2%) takes roughly 80,600 impressions per variation, about 161,200 total. Distinguishing a 50% lift (2.0% vs. 3.0%) takes about 3,800 per variation. These are illustrative estimates, not universal requirements, but the pattern holds: the smaller the difference you want to detect, the more evidence it takes, often dramatically more.
And remember, those are eligible impressions for the experiment, not total website page views.
For most sites, waiting to accumulate hundreds of thousands of eligible impressions on a single promotion isn’t realistic. That doesn’t mean the math is broken. It means there genuinely isn’t enough evidence yet to confidently tell two similar outcomes apart. SiteSqueeze doesn’t try to make that uncertainty disappear. It tries to make it useful.
Why Bayesian Probability
SiteSqueeze evaluates each test with a Bayesian model instead of a simple significance check. The marketer-facing question is straightforward: given what we’ve observed so far, how probable is it that one variation meaningfully outperforms the other?
Each variation starts with a weak, neutral prior, no assumption that A or B is better going in. As impressions and clicks accumulate, the model updates. If A gets 100 impressions and 3 clicks, SiteSqueeze isn’t just recording “3% CTR,” it’s also tracking how much uncertainty a sample that size still carries. More evidence narrows that uncertainty; a small sample leaves plenty of it.
Consider Control A at 70 impressions/2 clicks (2.86% CTR) versus Variation B at 70 impressions/3 clicks (4.29% CTR), a roughly 50% relative difference. The entire gap is one click. With that little data, the Bayesian distributions stay wide, and SiteSqueeze won’t call B a winner. That’s the model doing its job: describing the strength of the evidence, not manufacturing evidence that isn’t there. Bayesian statistics don’t turn 100 impressions into 10,000; they just let SiteSqueeze be honest about what 100 impressions can and can’t tell you.
Being Better Isn’t Enough: Minimum Meaningful Improvement
Suppose enough traffic eventually accumulates to be confident that B converts at 2.10% against A’s 2.00%, a real, 5% relative improvement. Is it worth acting on? That depends on what changing promotions costs you. For one business 5% might be substantial; for another, not worth the redesign.
That’s why every SiteSqueeze test includes a Minimum Meaningful Improvement setting: 10%, 20%, 30%, or 50%, default 20%. It changes the question from “is B better than A?” to “is B better than A by at least the margin I’ve said actually matters?” It also keeps a test from burning traffic chasing a difference you wouldn’t act on anyway.
None of the four options is a statistical constant, they’re a product default you can adjust. Ten percent lets smaller gains count but needs more evidence to confirm. Fifty percent demands a much bigger, easier-to-detect gap but can miss smaller wins that still matter. Twenty percent is a reasonable middle ground. The right setting depends on your situation: high-volume sites where small lifts move real revenue might set it lower; lower-traffic content sites that wouldn’t switch promotions without a dramatic difference might set it at 30-50%. Decide before you see results, or it’s easy to move the goalposts once you know which variation is ahead.
Minimum Meaningful Improvement isn’t the same thing as Minimum Detectable Effect (MDE), a term you may know from traditional test planning. MDE is a planning input, the effect size an experiment is designed to have a given chance of detecting (that’s what my A/B Test Traffic and Sample Size Calculator uses to estimate required traffic). Minimum Meaningful Improvement is a decision input: how large a difference has to be before you’d actually act on it. One tells you how much evidence to collect. The other tells you what you’re trying to learn.
Why Seven Full Days
SiteSqueeze won’t recommend a winner before a test has run seven full active days. That’s not a statistical threshold, it’s a guardrail against weekly traffic patterns: newsletter spikes, weekend drop-off, a business audience that behaves differently Saturday morning than Monday afternoon. Seven days gives both variations a shot at one full weekly cycle. Paused time doesn’t count toward it. Seven days opens the door to a recommendation. It doesn’t guarantee one.
What It Actually Takes to Recommend a Winner
Higher current CTR, more clicks, more impressions, none of it decides a winner on its own. A recommendation requires the test to have run seven full active days and the Bayesian evidence to show at least a 95% probability that the favored variation beats the other by your selected Minimum Meaningful Improvement. If you’ve set that threshold to 20%, SiteSqueeze isn’t asking whether B is probably a little better. It’s asking whether there’s at least a 95% posterior probability that B beats A by 20% or more.
Worth being precise about what that 95% means: it’s not a guarantee B keeps winning forever. It’s the model’s confidence, given the evidence collected in this experiment, that the current gap is real and meaningful. Future traffic sources, seasonality, or a promotion going stale can all change outcomes going forward. The number describes the evidence you have, not a warranty on what happens next.
A 50/50 Split Won’t Show Identical Impressions
Allocation runs approximately 50/50, but random assignment alone won’t produce matching totals, the same way flipping a fair coin 100 times won’t guarantee exactly 50/50. SiteSqueeze also uses best-effort sticky assignment: once a browser is assigned to A, it tries to keep showing that browser A on return visits rather than switching it, which is better for the visitor and the experiment but can widen the gap between observed totals over time. SiteSqueeze tracks new assignments separately from cumulative impressions so you can check whether initial allocation looks balanced. Either way, impression counts never determine the winner; clicks relative to impressions do.
SiteSqueeze Is Allowed to Say “I Don’t Know”
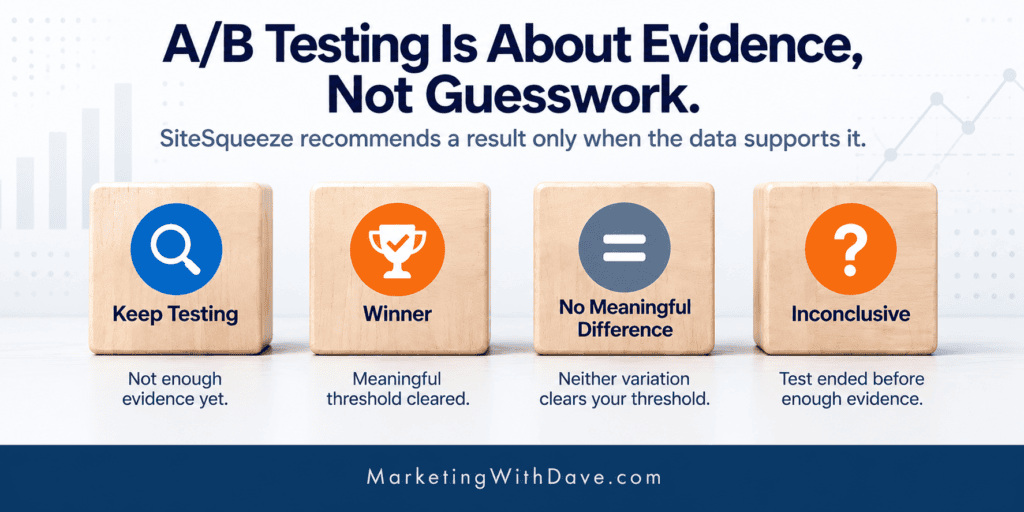
A testing tool shouldn’t be rewarded for always producing a winner. SiteSqueeze can return four outcomes:
- Keep Testing – not enough evidence yet for a responsible recommendation. One variation may be ahead; that’s not the same as knowing it’ll stay ahead.
- Control A Recommended / Variation B Recommended – seven days, 95% probability, and your Minimum Meaningful Improvement are all satisfied.
- No Meaningful Difference – the evidence shows neither variation clears your chosen threshold. Not “identical,” just not different enough to justify a change. If B took hours of extra design work for no real gain, keeping A is the better call.
- Inconclusive – the test hit a stopping condition (end date, impression or click cap) before the uncertainty resolved.
“The test is over” and “we know which version is better” aren’t the same statement. SiteSqueeze would rather return Inconclusive than manufacture certainty the evidence doesn’t support.
Put together, the logic runs roughly like this: has the test hit seven full active days? If not, Keep Testing. If yes, does the evidence show 95%+ probability of a meaningful winner? If yes, recommend it. If not, does the evidence support No Meaningful Difference? If yes, that’s the result. If neither and the test is still running, Keep Testing continues. If a stopping condition ends the experiment first, Inconclusive.
Reading Results, and Why the Date Filter Doesn’t Rewrite Them
The A/B Tests section of Performance shows impressions, clicks, and CTR per variation, plus relative lift so you can judge the size of the gap rather than raw CTR alone. The Bayesian statistics show the probability that one variation meaningfully outperforms the other, and the recommendation status translates that into Keep Testing, No Meaningful Difference, or a named winner. You can also break results down by page, since aggregate numbers can mask real differences across content.
You can filter Performance reporting by date for analysis (Today, Last 30 Days, before/after some site change), but the official recommendation always uses the full experiment history. If B has accumulated enough evidence to be recommended over the whole test, switching the filter to “Today” won’t make SiteSqueeze forget what it learned before midnight. The filter changes the data you’re exploring. It doesn’t rewrite the experiment.
What SiteSqueeze A/B Testing Can’t Do
- It can’t manufacture certainty from traffic that isn’t there.
- Best-effort sticky assignment can’t perfectly identify the same person across every browser, device, and privacy setting.
- CTR is the outcome being optimized right now; a click doesn’t tell you whether that visitor later purchased or subscribed.
- Seven days doesn’t guarantee sufficient evidence, and a 95% Bayesian probability isn’t a 95% guarantee about tomorrow.
If Your Test Isn’t Producing an Answer
If Keep Testing or Inconclusive keeps showing up, the fix usually isn’t SiteSqueeze, it’s the question being asked. A few options: test a bigger difference (a 30% lift needs far less traffic than a 10% one), raise the Minimum Meaningful Improvement if you wouldn’t act on a small gain anyway, widen the placement to more eligible pages, or accept that “the evidence doesn’t support a change yet” is itself a useful, honest answer. The A/B Test Traffic and Sample Size Calculator can estimate roughly how much traffic and time a given comparison would realistically need.
The A/B Test Traffic and Sample Size Calculator can estimate roughly how much traffic and time a traditional comparison would require. If limited traffic is the bigger challenge, I’ve also written about how to A/B test a low-traffic website when traditional statistical significance may be impractical.
Better Decisions, Not Manufactured Certainty
SiteSqueeze isn’t built to guarantee every test ends with a winner. It’s built to call one only when seven days, a meaningful threshold, and 95% Bayesian confidence all agree, and to say Keep Testing, No Meaningful Difference, or Inconclusive when they don’t. Sometimes the most useful thing a testing tool can tell you isn’t which variation won. It’s that the evidence hasn’t earned a winner yet.
SiteSqueeze is coming soon: a WordPress plugin for promoting your own content and running practical A/B tests without pretending every site has enterprise-level traffic. Join the list to know when it launches.
SiteSqueeze is coming soon.
I’m building a WordPress plugin designed to help marketers promote their own content, measure what works, and run practical A/B tests without pretending every website has enterprise-level traffic.
Join the list to know when SiteSqueeze launches.