social media roi

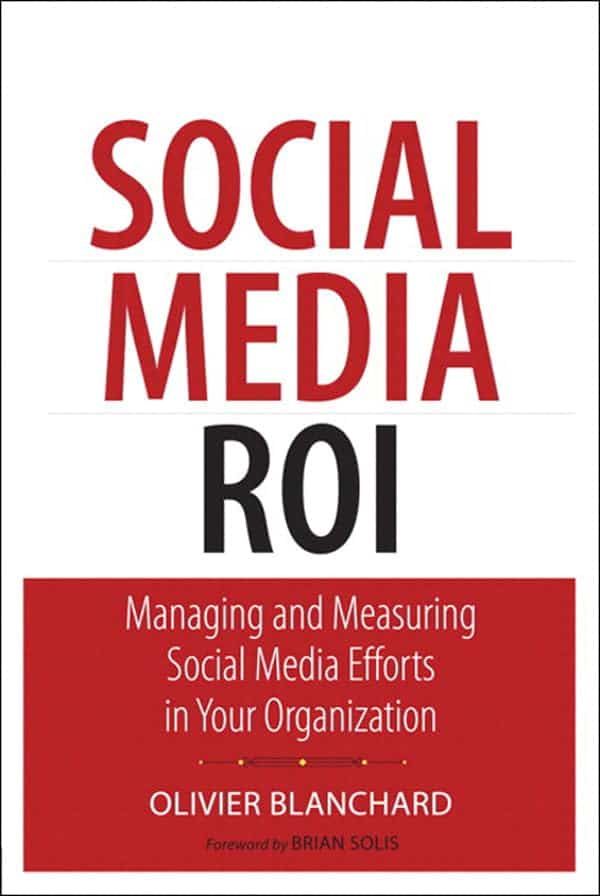
Social Media ROI by Olivier Blanchard Book Summary

Reading Time: 4 minutes

Top Three Quotes

  1. “The value of social media is not the platform, it is what you do with it.”
  2. “If you don’t understand how to measure ROI, you don’t understand business.”
  3. “Social media is not free. It takes time, it takes resources, and it takes money.”

Book Theme

Social Media ROI’s main theme is demystifying social media’s impact on business performance, focusing on how to measure, manage, and optimize social media activities to generate clear, quantifiable ROI.

Why You Should Read This Book

You manage marketing budgets and must demonstrate clear, measurable returns on investment to executives or stakeholders.

You need to prove the business value of social media initiatives and show how they contribute to revenue or cost savings.

You want to move beyond surface-level metrics such as likes, shares, and followers, and instead focus on meaningful business outcomes.

You are looking for a structured framework that helps integrate social media activities into your organization’s broader business objectives.

Key Ideas and Arguments Presented

Sustainability: Success requires long-term commitment and appropriate resource allocation over time.

Social Media Requires Business Alignment: Social media efforts must connect directly to overall business objectives.

ROI Must Be Defined Clearly: The return on investment in social media should be tied to measurable financial outcomes rather than vanity metrics.

Strategy Before Tactics: Many organizations jump into social platforms without a clear strategy, but the book emphasizes the need for thorough planning first.

The Importance of Governance: It is essential to establish policies, processes, and guidelines to manage risks and ensure consistency across teams.

Measurement Framework: Clear definitions of goals, key performance indicators, and success criteria are critical for tracking progress and impact.

Change Management: Adopting social media affects company culture and workflows, so managing this change intentionally is necessary.

Training and Enablement: Employees and teams require education on tools, processes, and expectations to be effective.

Customer Engagement: Listening to customers, responding effectively, and creating value for the audience are fundamental components of social media success.

Integration with Other Functions: Social media cannot operate in isolation and should be connected to sales, customer service, and product teams.

Book Outline

The following are the main sections and chapters as listed in the book:

  • I. Social Media Program Development
    • 1. Creating the Social Company
    • 2. Aligning Social Media to Business Goals
    • 3. Planning for Performance Measurement
    • 4. Establishing Clarity of Vision, Purpose, and Execution
  • II. Social Media Program Integration
    • 5. Understanding How Social Media Plugs into the Organization
    • 6. The People Principle
    • 7. Establishing Social Media Guidelines for the Organization
    • 8. Laying the Operational Groundwork for Effective Social Media Management
    • 9. The New Rules of Brand Communications in the Age of Social Media
  • III. Social Media Program Management
    • 10. Listening Before Talking
    • 11. Social Media and Digital Brand Management
    • 12. Real-Time Digital Support: Fixing Customer Service Once and for All
    • 13. Social Media Program Management: Putting It All Together
  • IV. Social Media Program Measurement
    • 14. Creating a Measurement Practice for Social Media Programs
    • 15. ROI and Other Social Media Outcomes
    • 16. F.R.Y. (Frequency, Reach, and Yield) and Social Media
    • 17. Social Media Program Analysis and Reporting

Key Takeaways

  1. Training and change management are critical elements that are often overlooked but essential for success.
  2. Social media ROI is achievable and measurable when objectives are clearly defined.
  3. Businesses must approach social media as an investment rather than treating it as a side project.
  4. Metrics should be linked to actual business outcomes instead of focusing only on engagement numbers.
  5. Establishing governance helps reduce risk and improve efficiency across teams.

Key Techniques

ROI Calculation Templates: Apply practical formulas and templates to quantify and demonstrate financial returns.

Measurement Frameworks: Define goals, key performance indicators, and conversion metrics early in the process.

Social Media Audit: Evaluate the current state of your social media presence and readiness for improvement.

Governance Model: Establish clear rules, escalation paths, and responsibilities to manage activity and risks.

Alignment Process: Connect social media objectives directly to overall business strategies and priorities.

Author’s Qualifications

Olivier Blanchard is a recognized expert in brand management and social business strategy. His background includes:

  • One of the earliest voices advocating for accountability in social media investments
  • Principal at BrandBuilder Marketing
  • Consultant for global brands across multiple industries
  • Frequent speaker on social media measurement and digital transformation

Comparison to Similar Books

Compared to Measure What Matters by Katie Delahaye Paine, Blanchard provides more comprehensive operational guidance for implementing ROI programs.

Compared to Groundswell by Charlene Li and Josh Bernoff, Social Media ROI is more focused on financial measurement rather than adoption strategies.

Unlike Trust Agents by Chris Brogan and Julien Smith, this book emphasizes processes and frameworks instead of storytelling.

Target Audience

  • Business Analysts responsible for marketing KPIs
  • Marketing Directors and Managers
  • Social Media Strategists
  • Digital Transformation Leads
  • CMOs and Executive Leadership
  • Small Business Owners who are serious about measurement
  • Consultants and Agency Professionals

Critical Response to the Book

Social Media ROI has been widely praised for:

  • Providing practical frameworks in an area often dominated by hype
  • Demystifying complex measurement concepts
  • Being accessible without oversimplification

Some critiques note:

Certain examples could be more current as platforms evolve

It assumes readers have some foundational marketing knowledge

One Sentence Takeaway

Social media only becomes valuable to business when you align it with strategy, measure its impact rigorously, and treat it as an investment that demands accountability.

Social Media ROI by Olivier Blanchard Book Summary Read More »
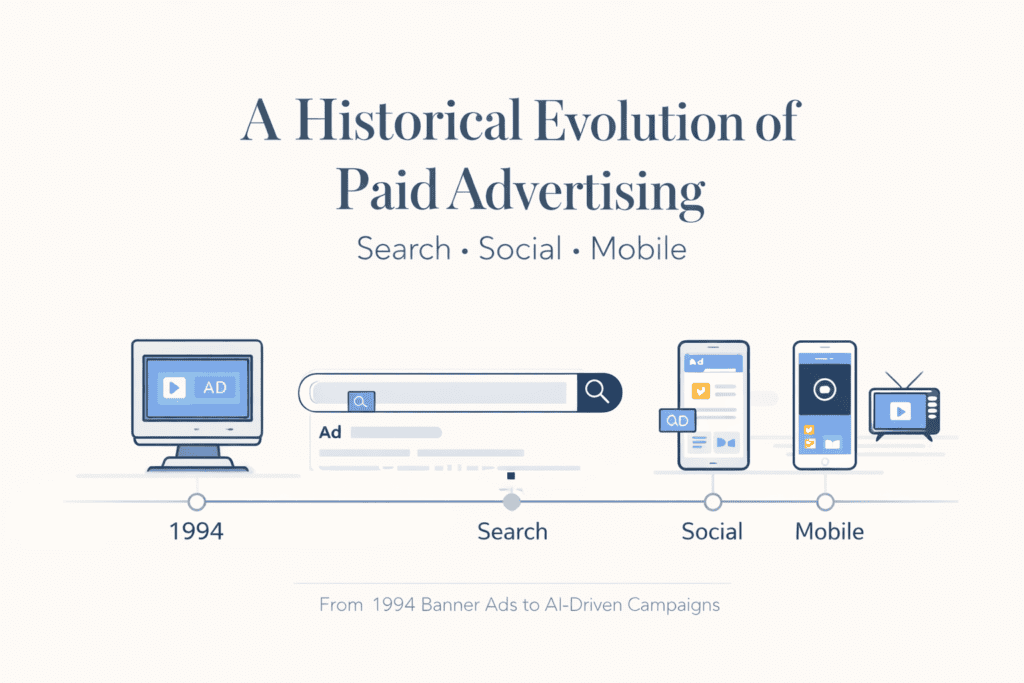
a historical evolution of paid advertising search social and mobile innovations

A Historical Evolution of Paid Advertising: Search, Social, and Mobile Innovations

Reading Time: 2 minutes

Paid digital advertising has come a long way since the first banner ad appeared on the web in 1994. From the early days of pop-ups and static banners to today’s sophisticated, AI-driven campaigns, online advertising has reshaped how brands reach and engage audiences. This timeline highlights the pivotal moments, platforms, and innovations, from Google Ads and Facebook to TikTok and connected TV, that turned the internet into the world’s most powerful advertising medium.

1994

October – The first banner ad appears on HotWired.com, promoting AT&T, and achieves a 44% click-through rate.

1997

– Pop-up ads are invented at Tripod.com, quickly spreading across the web.

1998

February – Goto.com launches pay-per-click search advertising, pioneering keyword bidding.

2000

October – Google AdWords launches with self-serve ads and cost-per-impression pricing.

2002

– Google AdWords transitions to cost-per-click auctions, factoring in ad relevance.

2003

– Google launches AdSense, enabling contextual ads on publisher websites.

2005

– Google introduces Quality Score in AdWords, rewarding relevant ads with better placements and lower costs.

2007

November – Facebook launches its Ads platform, combining Pages, targeting, and Social Ads.

2009

– Google introduces remarketing, enabling advertisers to retarget past website visitors.

2010

April – Twitter launches Promoted Tweets, entering the paid social advertising market.

2012

March – Facebook introduces Custom Audiences, letting advertisers target uploaded contact lists.

2013

October – Instagram launches sponsored posts, integrating ads into users’ feeds.

2015

September – Instagram Ads open globally to all advertisers via Facebook’s platform.

2018

June – Google rebrands AdWords to Google Ads and unifies its advertising products under Google Marketing Platform.

2019

April – TikTok launches its self-serve ad platform, allowing brands to create in-feed video ads.

2020

March – COVID-19 accelerates digital ad spending as businesses shift online during lockdowns.

2021

April – Apple launches App Tracking Transparency, reshaping mobile advertising and attribution.

2023

July – Twitter rebrands to X, signaling ambitions beyond social media.

A Historical Evolution of Paid Advertising: Search, Social, and Mobile Innovations Read More »

a historical evolution of marketing surveys nps csat and voice of customer

A Historical Evolution of Marketing Surveys: NPS, CSAT, and Voice of Customer

Reading Time: 1 minute

Marketing surveys have played a pivotal role in shaping the way businesses understand and engage with their customers.

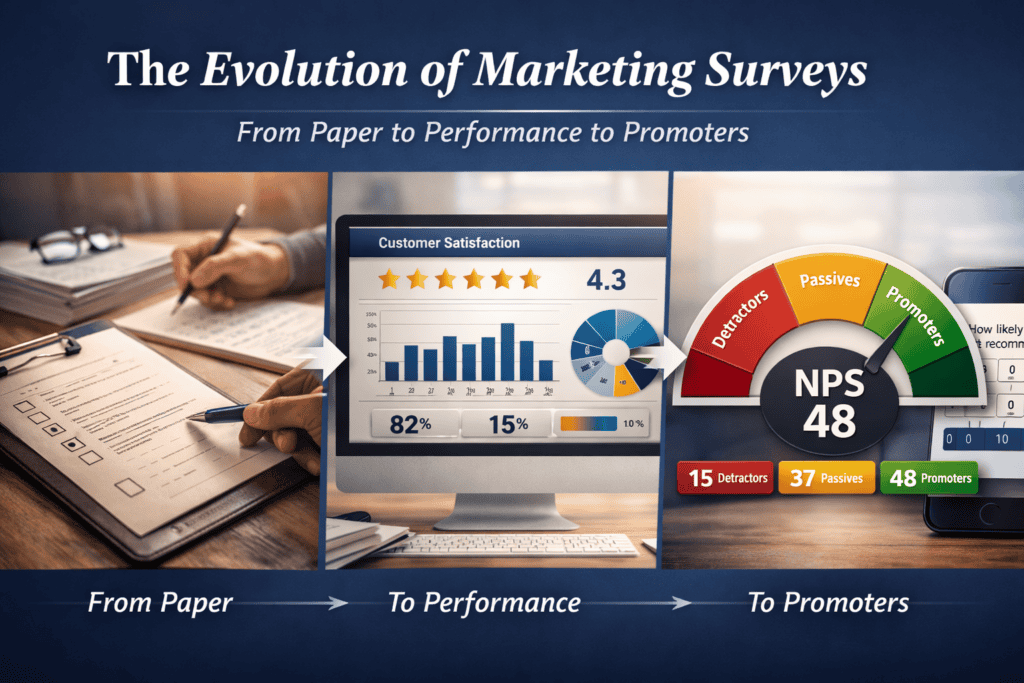
From the early days of simple feedback forms to the sophisticated tools we use today, surveys like Net Promoter Score (NPS), Voice of Customer (VoC), and Customer Satisfaction (CSAT) have evolved significantly. This timeline takes you through the history of these essential survey methods, exploring their development and impact on modern marketing strategies.

1750 BC

Circa – A Babylonian merchant writes the first known customer complaint on a clay tablet.

1912

– Charles Parlin conducts the first large-scale consumer surveys in the US, launching modern market research.

1932

– Rensis Likert introduces the 5-point Likert scale to measure attitudes in surveys.

1936

– George Gallup demonstrates the power of scientific sampling in surveys by correctly predicting the US presidential election.

1968

– J.D. Power and Associates begins surveying auto customers, launching industry benchmarks for satisfaction.

1970s

– Computer-assisted telephone interviewing (CATI) systems start replacing paper-based phone surveys.

1984

– The Kano Model is published, categorizing customer needs into basic, performance, and delight factors.

1993

– The term “Voice of the Customer” is formalized by Griffin and Hauser.

1994

October – The American Customer Satisfaction Index (ACSI) launches as the first national cross-industry benchmark.

1999

– SurveyMonkey is founded, making online surveys accessible to anyone.

2002

– Qualtrics is founded, expanding online survey tools into enterprise research.

2003

December – Net Promoter Score (NPS) is introduced in Harvard Business Review’s “The One Number You Need to Grow.”

2010

July – Customer Effort Score (CES) debuts in HBR’s “Stop Trying to Delight Your Customers.”

2010s

– Mobile surveys, SMS feedback, and in-app questionnaires become widespread as smartphones proliferate.

2020

March – The COVID-19 pandemic accelerates the use of online surveys as in-person methods pause.


A Historical Evolution of Marketing Surveys: NPS, CSAT, and Voice of Customer Read More »

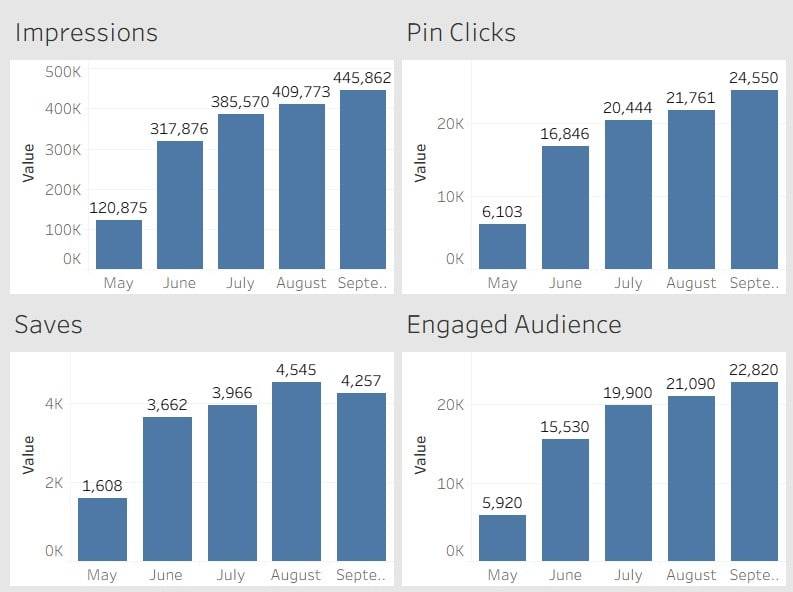
Graph showing Pinterest analytics data including impressions, pin clicks, saves, and engaged audience over several months for marketing insights.

Unlocking the Power of Pinterest Analytics: Why You Should Convert to a Business Profile

Reading Time: 3 minutes

If you are using Pinterest to build your brand, drive traffic, or grow an audience, it is easy to overlook the wealth of data hiding behind the scenes. One of the simplest ways to level up your Pinterest strategy without spending a dime is to convert your profile to a business account.

This change does not cost anything and it unlocks a much richer set of analytics that can help you see what is working and where to improve.

What You Get When You Upgrade

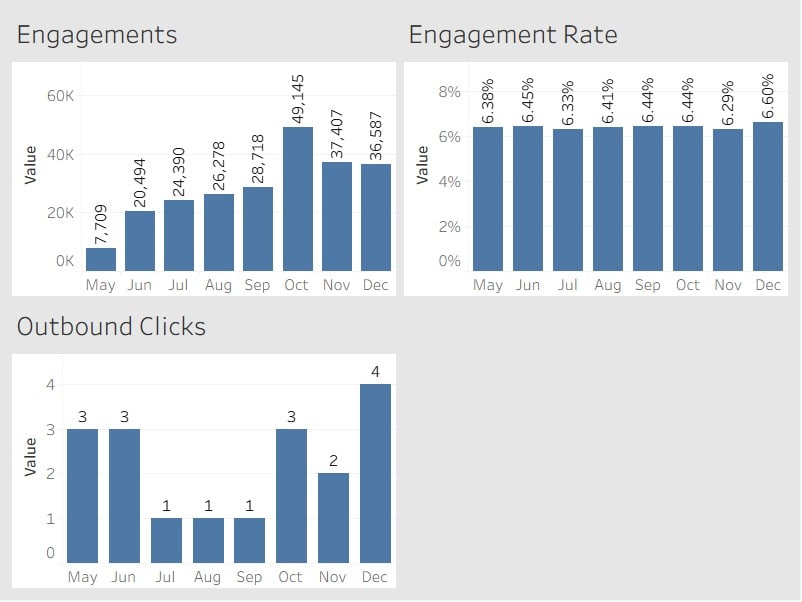
A personal Pinterest account gives you only a basic snapshot of your activity. Switching to a business profile opens access to detailed performance metrics, including Impressions, Engagements, Pin Clicks, Outbound Clicks, Saves, Engagement Rate, Outbound Click Rate, Average Save Rate, Total Audience, and Engaged Audience.

From these, I have found some metrics to be especially valuable in assessing whether my content is resonating. These include Impressions, Engagements, Pin Clicks, Outbound Clicks, Saves, Engagement Rate, Pin Click Rate, Outbound Click Rate, and Engaged Audience.

Below, I am sharing two dashboards that show my Pinterest account’s performance in May and June. My plan is to update these monthly to track progress as I continue adding fresh pins, including both my own content and curated pins from others.

Tips for Measuring Pinterest Analytics

Here are some sound best practices to consider.

  1. Look beyond vanity metrics. Impressions are helpful, but saves and outbound clicks tell you who is actually taking action.
  2. Track trends over time. A single week does not tell the full story, so watch for sustained improvement or decline over several months.
  3. Segment your data. Compare performance between your original content and re-pins. Often, your own pins will be the biggest drivers of outbound clicks.
  4. Watch your save rate. Pins with high save rates often have evergreen value, so consider promoting them further or creating similar content.
  5. Export your data. Although Pinterest provides some helpful charts in the app, serious reporting is largely a manual exercise. You will need to export metrics or compile them in your own dashboards to get a clear picture.
  6. Leverage rich pins and keyword optimization. Enhanced pins with extra metadata often outperform standard pins in both impressions and engagement.

Why Most People Miss Out

Many users never realize this level of reporting exists because it requires a business profile. Pinterest does not exactly shout about it. If you are serious about measuring what works and refining your strategy, this is an upgrade you cannot afford to skip.

Curious about who’s engaging with your Pins?

Check out my guide to Pinterest Audience Insights and see what data you can unlock.

Glossary of Key Pinterest Metrics

Average Save Rate: Saves divided by impressions.

Engaged Audience: Unique viewers who took action on your pins.

Engagement Rate: Engagements divided by impressions.

Engagements: Total actions like saves, clicks, or close-ups.

Impressions: How often your pins appeared on screen.

Outbound Click Rate: Outbound clicks divided by impressions.

Outbound Clicks: Clicks that send people to your website or link destination.

Pin Clicks: Clicks that open your pin in detail.

Saves: Pins added to users’ boards.

Total Audience: Unique viewers who saw your pins.

Unlocking the Power of Pinterest Analytics: Why You Should Convert to a Business Profile Read More »

case study excite purchase google

Case Study: How Excite’s $750K Google Rejection Became a Historic Blunder

Reading Time: 7 minutes

Brief Summary

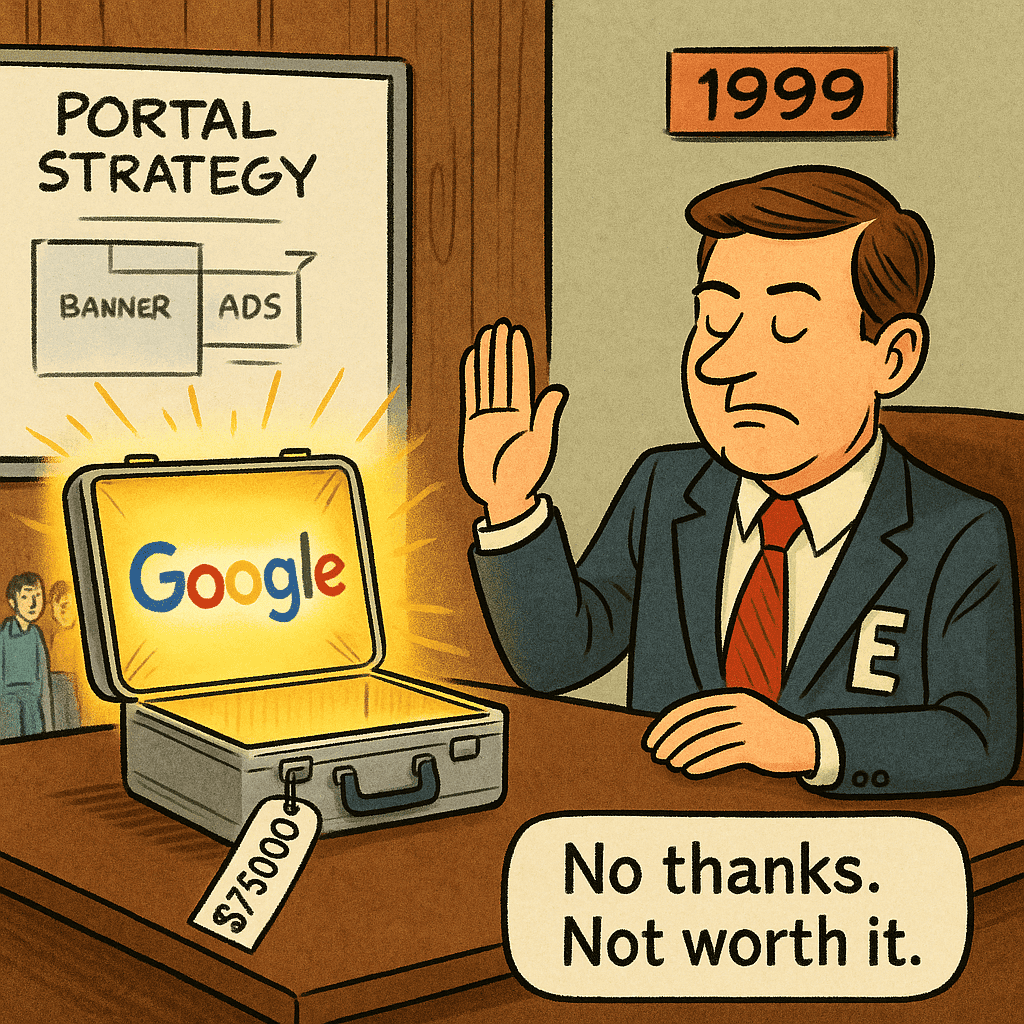
In the late 1990s, web portal Excite had the chance to acquire Google’s search technology for under $1 million. Excite’s executives, however, worried that Google’s superior search would cause users to leave the Excite site faster, hurting ad revenues.

Believing the new search wasn’t significantly better than their own, Excite walked away from the deal. In hindsight, this decision, essentially passing on Google, is often cited as one of the worst business mistakes in tech history. Google went on to become a trillion-dollar giant, while Excite faded into obscurity.

Company Involved

Excite was once a leading internet search portal and content site in the 1990s. The company, founded in 1994 and booming during the dot-com era, was approached by the young founders of Google (then a Stanford project called BackRub) about a potential acquisition. Excite’s handling of that offer is the focus of this case study.

Marketing Topic

  • Strategy
  • Advertising
  • Customer Experience

Public Reaction or Consequences

At the time, Excite’s decision to reject Google’s offer went largely unnoticed by the public – the negotiations were behind closed doors. But as Google’s success became apparent, this story entered tech industry lore as a legendary blunder. Analysts and bloggers frequently point to Excite’s choice as a cautionary tale of short-sighted leadership. The consequences for Excite were severe: it quickly fell behind in the search market, lost users to Google and other rivals, and never recovered. By 2001, Excite’s parent company went bankrupt amid the dot-com bust, and in 2004 what remained of Excite was acquired by Ask Jeeves (now Ask.com). In contrast, Google transformed into one of the world’s most valuable and dominant tech companies.

Why It Matters Today

  • Demonstrates the perils of short-term thinking. Excite worried about immediate ad revenue and failed to see the long-term value of superior search technology.
  • Highlights the importance of embracing disruptive innovation. Ignoring or underestimating a breakthrough (like Google’s algorithm) can leave a company obsolete.
  • Reminds marketers and executives that user experience is king. Trying to keep users “stuck” on your site for ad views backfired – ultimately, delivering the best user solution (even if it changes your business model) is critical for sustained success.

3 Takeaways

1. Don’t let short-term metrics blind you – Focusing solely on current revenue (page views, ad clicks) can cause you to miss transformational opportunities.

2. Be willing to adapt or partner – Embracing new technology early, even if it disrupts your existing operations, may secure your company’s future.

3. Prioritize product quality and user value – Delivering the best experience for customers will drive long-term growth, even if it means rethinking how you monetize.

Notable Quotes and Data

“The Stanford product was too good… If Excite were to host a search engine that instantly gave people information they sought… users would leave the site instantly. Since his ad revenue came from people staying on the site… using BackRub’s technology would be counterproductive.

“Larry Page actually insisted… that we would have to rip out all of the Excite search technology and replace it with Google… we concluded that… [the differences] really weren’t significant and we passed on the chance to buy it… I didn’t feel that that was a risk… I wanted to take.” – George Bell, former Excite CEO

In 1999, Excite declined to buy Google for roughly $750,000; by 2018 Google’s value was around $367 billion, while Excite was sold for just $343 million in 2004.

Full Case Narrative

Background: In the mid-1990s, Excite was one of the web’s top portals, offering search, news, email, and more. It was the sixth most-visited website in 1997, competing with the likes of Yahoo!, Lycos and AltaVista in the early search engine market. Google, meanwhile, began as an academic project (originally nicknamed “BackRub”) by Larry Page and Sergey Brin at Stanford University. By 1998-1999, Page and Brin had developed a radically better search algorithm and were looking for a way to commercialize it – or possibly sell it, so they could return to their studies.

The Offer: Google’s founders approached Excite in 1999, through venture capitalist Vinod Khosla (an early Excite backer), and offered to sell Google’s search technology for around $1 million. Khosla helped negotiate the price down to approximately $750,000 in cash plus some Excite stock. In essence, for well under $1 million, Excite could have acquired what would become Google. However, Larry Page had one major stipulation: Excite had to replace its own search engine with Google’s if the deal went through. Google’s team believed their algorithm would vastly improve Excite’s search results, but this condition meant Excite would be discarding its existing search technology and possibly some of its engineering team’s work.

Excite’s Perspective: Excite’s CEO George Bell and his team were hesitant. Internally, Excite ran tests comparing Google’s search results to their own. According to Bell, those tests did not show a dramatic difference at the time, and the team believed their results were not significantly worse in the eyes of users. Excite was also proud of its in-house technology and culture as a search company. Replacing their core search engine with Google’s was seen as a drastic step that could undermine morale and the company’s identity. Bell later recalled worrying that the cultural risk of swapping in Google’s technology was too high if the benefits seemed limited. Meanwhile, Page and Brin were primarily interested in selling so they could return to their studies at Stanford.

Moreover, an account described in journalist Steven Levy’s book In The Plex suggests Excite had a deeper concern: Google’s search worked too well. During a demo, Google (BackRub) produced extremely relevant results that would answer users’ queries quickly. Excite’s portal business model relied on “stickiness” – keeping users engaged on its pages to show them ads. If an ultra-efficient search engine sent people away faster, it could reduce ad impressions. From this viewpoint, adopting Google’s superior search might have threatened Excite’s advertising revenue. (Bell has disputed that this was a deciding factor, but it’s a narrative that spread widely.

The Decision: Ultimately, George Bell and Excite’s leadership rejected the Google deal. Even after the price was lowered and despite Google’s promise, Excite walked away in 1999. Bell gave Khosla and the venture capitalists the go-ahead to invest in Google instead, since Excite wouldn’t be taking it over. In hindsight, Bell acknowledged that as CEO it was his decision – and one that “in the end, of course, I did make”. At the time, however, he believed he was protecting Excite’s culture and stability.

Fallout: The consequences of passing on Google became apparent within a couple of years. The search landscape of the early 2000s shifted dramatically. Google continued to refine its search engine and began to attract millions of users, quickly outpacing older portals. Excite, on the other hand, struggled. The dot-com bubble burst hit Excite hard: in 2001 Excite’s parent company (Excite@Home) went bankrupt. The Excite portal changed hands, eventually being acquired by Ask Jeeves by 2004. By then, Google was on an explosive growth trajectory: it launched AdWords, set the standard for search advertising, and went public in 2004 with a market capitalization in the tens of billions. Excite, lacking a strong differentiator, faded from prominence. Its brand survived in a diminished form (today Excite.com still exists, owned by IAC, but it’s a minor web portal with no influence in the search market.

Analysis – Why Excite Said No: Why would a company refuse a deal that looks, in retrospect, like a no-brainer? Excite’s case shows how context and mindset matter. In 1999, $750,000 was a small price, but Google was an unproven startup with just a handful of employees. Excite was a well-known internet player; from their view, Google’s algorithm didn’t obviously blow away what Excite already had. Also, integrating Google implied admitting Excite’s own technology wasn’t top-notch. That was a hit to pride and could mean upheaval – possibly laying off parts of Excite’s engineering team or reallocating resources. Bell and his team likely thought they were making a prudent choice: why fix what isn’t broken, especially if it might disrupt your business?

There was also a prevailing portal strategy at the time. Portals like Excite and Yahoo were not just about search – they wanted to be one-stop destinations where users would stay and browse multiple services. A design that quickly shuttles users off to external sites (which Google’s search excels at doing) seemed counter to this strategy. In essence, Excite failed to anticipate how the internet would evolve from portal hubs to specialized tools. The very metric they prized, keeping users on-site, was rendered less important once search engines (and later social networks) proved that delivering what users want, fast, leads to success and monetization in other ways.

Lesson for Marketers: Excite’s missed opportunity underscores the risk of being too committed to an existing business model. Successful marketing and product strategy require balancing the current revenue model with forward-looking innovation. Excite’s leadership feared cannibalizing their own traffic and ad earnings; Google, by contrast, focused on superior user experience and figured out monetization (through search ads) later – capturing huge market share in the process. Marketers today can learn from this. Clinging to short-term gains or familiar practices often means forfeiting game-changing growth. In fast-moving industries, it’s often better to disrupt yourself before someone else does.

Timeline

1999: Google’s Larry Page and Sergey Brin offer to sell their search engine to Excite for roughly $1 million. Excite CEO George Bell turns it down, even after the price is reduced to about $750,000.

2001: Excite@Home (Excite’s parent company) files for bankruptcy as the dot-com bubble collapses.

2004: Google launches its IPO, rapidly becoming a dominant tech company. The same year, Ask Jeeves acquires Excite’s portal business for a reported $343 million.

Present: Google (now part of Alphabet Inc.) is a global technology leader worth over a trillion dollars, while Excite exists only as a vestigial web portal owned by IAC, with minimal traffic and influence.

What Happened Next?

Excite’s decision not to buy Google is a textbook example of a missed opportunity. After 2004, Excite’s brand drifted into irrelevance. It became one of several small sites under the IAC umbrella, and has not been a meaningful player in the internet industry for decades. Google, on the other hand, revolutionized digital advertising and online information access. By prioritizing a better search product, Google unlocked a business model (search ads based on intent) that far outgrew portal banner ads. Excite’s earlier concerns about losing ad revenue were ironic – Google figured out how to make search ads immensely profitable without needing to trap users on a portal. In the end, Excite’s legacy is largely as a cautionary tale. The company that once sat near the top of the internet hierarchy is now remembered primarily for the giant that “got away.”

One Sentence Takeaway

Being fixated on preserving an old business model can cause you to miss the next big thing – a costly mistake that no marketer or business leader wants to repeat.

Sources and Citations

TechCrunch – “When Google Wanted To Sell To Excite For Under $1 Million (And They Passed)” (2010)

Internet History Podcast – “The Real Reason Excite Turned Down Buying Google for $750,000 in 1999” (2014)

Benzinga – “Former Excite.com CEO Explains Why He ‘Passed On’ Acquiring Google For Under $1 Million” (2015)

CEO Today – “8 of the Worst Business Decisions Ever Made” (2018)

BusinessWire – “The World’s Worst Business Decisions” (2020)

Case Study: How Excite’s $750K Google Rejection Became a Historic Blunder Read More »

Bar chart showing books read from 2013 to 2024 with peaks in 2020 and 2024, illustrating reading progress and data analysis for Goodreads users.

My Goodreads Data Story: Dashboards, an Interactive Chart, and 5-Star Recommendations

Reading Time: 2 minutes

Reader Beware: Any blog post tagged as “Data Driven David” may not be as related to marketing as most of my content. I truly love data and love it even more when it is well visualized and wrapped in a great story — now, that’s good marketing.

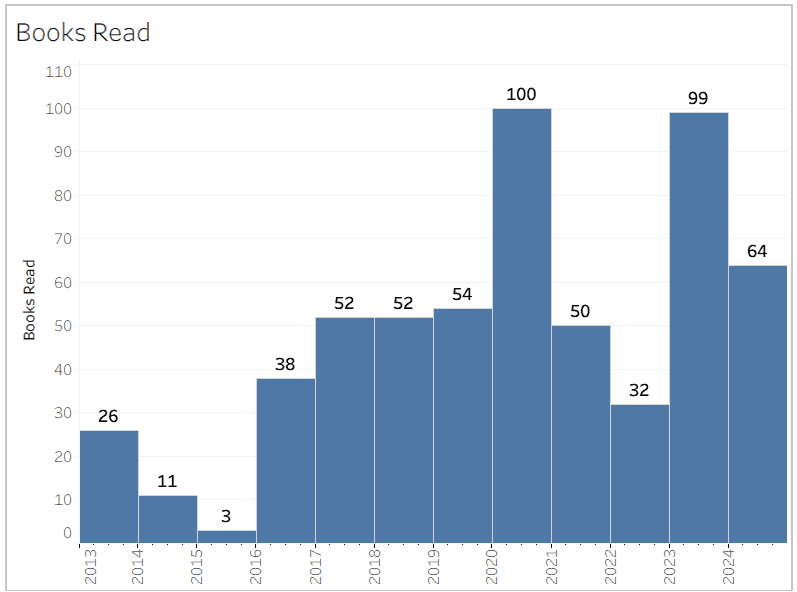
Since 2013, I’ve been tracking every book I’ve read in Goodreads. It’s been a fun way to look back on years of reading, especially since probably 80–90% of what I pick up is business-related, usually focused on marketing. In this post, I’m sharing some of my favorite charts and stats that highlight my reading habits over time. Whether you’re curious about how many books I’ve tackled or how many pages I’ve turned, you’ll find the details here.

If you’re interested, I’ve also put together a few Pinterest boards showcasing the books I’ve rated five stars across different genres:

Despite what the chart below shows, I know I’ve reached my goal of reading 100 books in a year twice. My oldest daughter would probably dismiss this achievement since most of them were audiobooks.

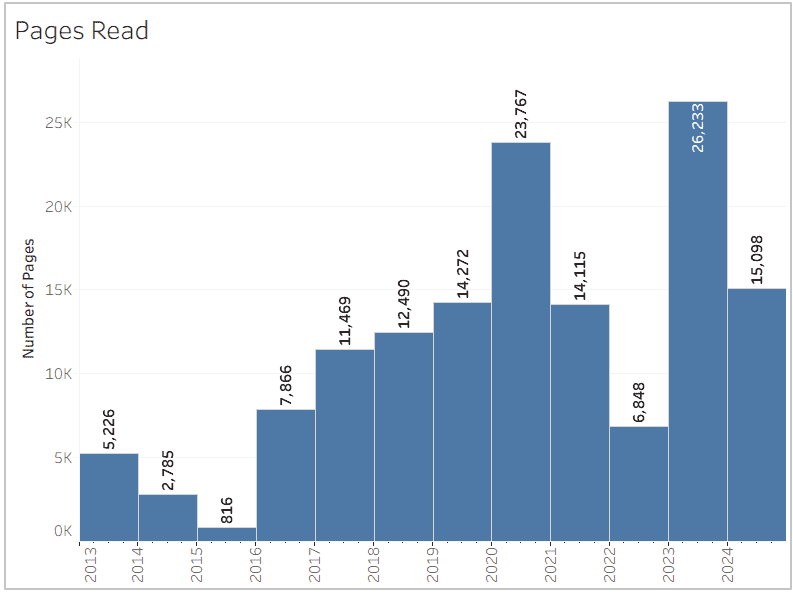
This next chart is similar, but instead of showing the number of books read, it tracks the number of pages. The data isn’t perfectly accurate because some books might be missing page counts, or the counts themselves might be incorrect, but most of the time it’s fairly reliable. Since I read a lot of business and religious books, many of them are under 200 pages. I considered combining this chart with the first one using a dual axis, with one as a line chart and the other as a bar graph. However, too many of the numbers overlapped and made the visual messy and confusing, even though it would have taken up less space than having two separate charts.

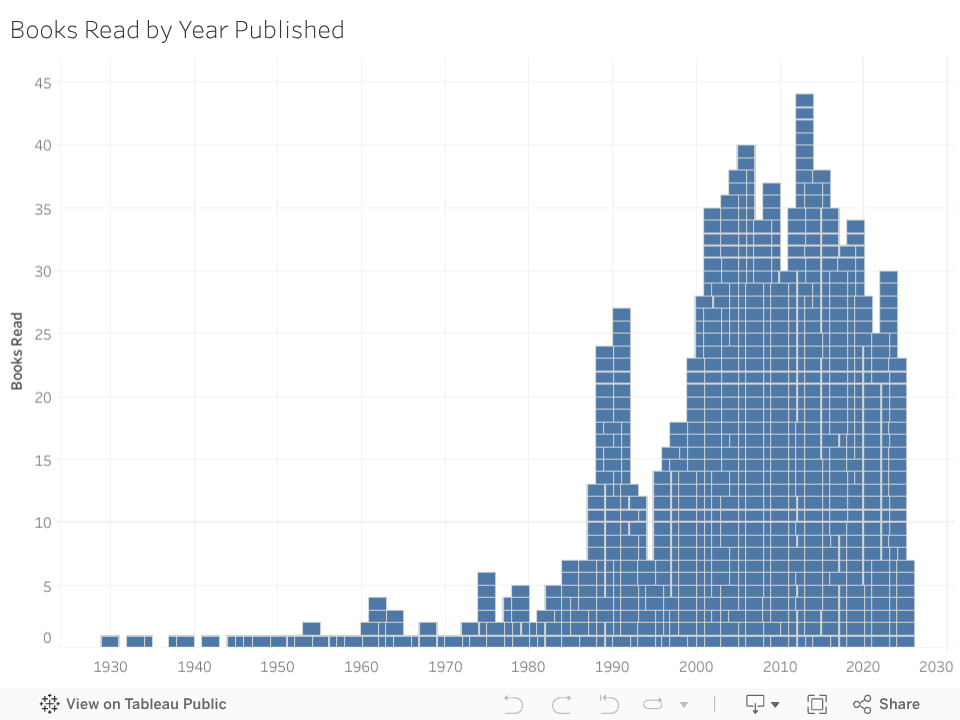
To date, I’m getting close to having read 1,100 books, and many of those were read before I started tracking in 2013. For the following chart, you can hover over any of the boxes by the year the book was published to see the book title, author, and my rating (if available). Earlier entries often lack ratings. This interactive chart is one of the great aspects of using Tableau.

My Goodreads Data Story: Dashboards, an Interactive Chart, and 5-Star Recommendations Read More »