case study coca cola new coke

Case Study: Coca‑Cola and the Launch of New Coke – A Branding Misstep That Sparked a Consumer Revolt

Reading Time: 3 minutes

Brief Summary

Coca Cola New Coke Case Study

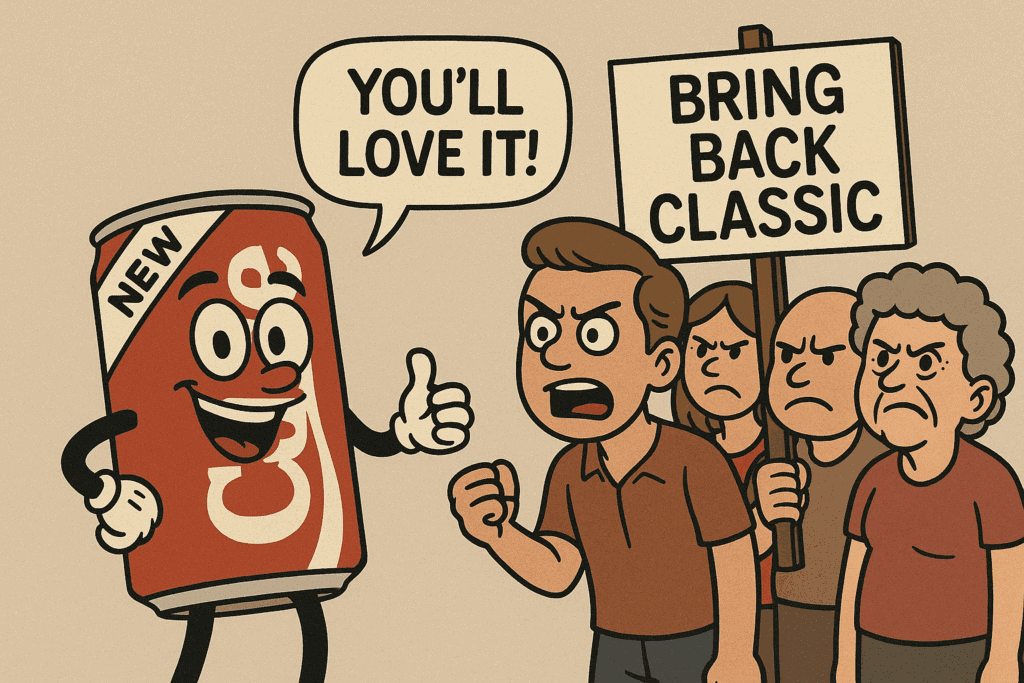
In April 1985 Coca‑Cola replaced its original formula with a sweeter version known as New Coke. The change aimed to regain market share from Pepsi, which had been gaining ground in blind taste tests and consumer preference.

Although the new formula initially tested well, the public reaction was overwhelmingly negative. After just 79 days, Coca‑Cola brought back the original recipe as Coca‑Cola Classic.

This incident is now widely cited as one of the most significant lessons in brand loyalty and the emotional attachment consumers have to legacy products.

Company Involved

The Coca‑Cola Company

Marketing Topic

Product Positioning, Brand Identity, Crisis Response, Consumer Experience

Public Reaction or Consequences

The backlash was immediate and intense. Coca‑Cola’s customer hotline received over 1,500 calls per day, up from 400. Protest groups formed, including the Old Cola Drinkers of America. Letters were addressed to executives with names like “Chief Dodo.” Media outlets and comedians mocked the decision. Even Fidel Castro publicly criticized the move, framing it as a sign of American capitalist decline.

Why It Matters Today

This case underscores how emotional branding can override product logic. It teaches marketers that data from tests and surveys must be weighed against cultural and emotional resonance. In an era where brand decisions are amplified by social media, the lessons from New Coke are more relevant than ever.

3 Takeaways

  1. Consumer emotions matter more than product features. Functional improvements may backfire if they disrupt brand identity.
  2. Test results do not equal market readiness. Blind taste tests showed preference for New Coke, but failed to capture the emotional importance of the original formula.
  3. Own your mistakes and respond quickly. Coca‑Cola’s swift reintroduction of the original formula helped recover its reputation and regain consumer trust.

Notable Quotes and Data

  • “The cola category in general was lethargic. Consumer preference for Coca‑Cola was dipping.” — Coca‑Cola executive, History.com
  • “By June 1985, the company hotline was getting 1,500 calls a day, compared with 400 a day before the taste change.” — History.com
  • “It was, Time declared, ‘like putting a miniskirt on the refurbished Statue of Liberty.'” — Time Magazine

Full Case Narrative

In the early 1980s Coca‑Cola was losing market share to Pepsi, particularly among younger consumers. Pepsi’s advertising campaigns, including the Pepsi Challenge, showcased how people preferred its sweeter formula in blind taste tests. Coca‑Cola launched Project Kansas, a secret initiative to develop a new, sweeter formula to compete directly.

On April 23, 1985, New Coke was introduced. The announcement was backed by taste tests showing that consumers preferred the new formula. Sales initially rose, but emotional backlash quickly followed. Consumers felt betrayed, viewing the change as an attack on tradition. Protest campaigns, media mockery, and fan outrage spread quickly.

Just 79 days later, Coca‑Cola announced the return of the original formula, now branded as Coca‑Cola Classic. The public welcomed it with enthusiasm, and sales rebounded. While New Coke remained on the market for years under the name Coke II, it never achieved significant success again.

The case remains a classic lesson on understanding customer sentiment, brand equity, and how not to ignore the voice of the consumer in pursuit of innovation.

Timeline

  • April 23, 1985: Coca‑Cola launches New Coke nationwide.
  • May 1985: Consumer backlash escalates. Hotline calls spike to over 1,500 per day.
  • June 1985: Protest groups form and public ridicule increases. Editorials, late-night jokes, and political commentary amplify criticism.
  • July 11, 1985: Coca‑Cola announces the return of the original formula, rebranded as Coca‑Cola Classic.

What Happened Next?

After the reintroduction of Coca‑Cola Classic, public perception of the brand improved. The company leaned into nostalgia with patriotism-themed ads and celebrity endorsements. New Coke remained on shelves as Coke II until it was quietly discontinued in 2002. Marketers today continue to study this case as an example of how product changes must consider not just performance, but identity, history, and emotional resonance.

One Sentence Takeaway

Even the most researched product launch can fail if it disconnects from the emotional core of your brand.

Sources and Citations

History.com, New Coke debuts, one of the biggest product flops in history, published April 23, 2024.

Encyclopedia Britannica, New Coke overview, accessed June 2025.

The Coca‑Cola Company, New Coke: The most memorable marketing blunder ever?, company history page.

Allrecipes, Coke Classic: The Story of How America Saved Its Favorite Drink, published June 2025.

Time Magazine, Here’s What New Coke Tasted Like, published April 23, 2015.

Food and Wine, We compared New Coke to Coca‑Cola – Here are our thoughts, published June 2019.

Case Study: Coca‑Cola and the Launch of New Coke – A Branding Misstep That Sparked a Consumer Revolt Read More »

case study target pregnant personalization 1

Case Study: Target’s Personalization Strategy That Went Too Far

Reading Time: 3 minutes

Brief Summary

In 2012, Target used predictive analytics to assign a “pregnancy prediction score” to customers based on their purchasing behavior. The algorithm identified a teenage girl’s pregnancy, prompting her father to complain after she received baby-related coupons.

Target later admitted to interspersing baby offers among general household ads to reduce creepiness, but the incident sparked a national outcry over privacy and personalization.

Company Involved

Target Corporation

Marketing Topic

  • Personalization
  • Data-driven strategy
  • Customer experience
  • Data ethics

Public Reaction or Consequences

  • A widely reported anecdote of a father complaining when baby coupons were delivered to his pregnant teen daughter.
  • Public backlash over ethical implications of inferring personal life events without consent.
  • Coverage in *NYT*, *Forbes*, *Time*, *Slate*.
  • Conversations about customer privacy, transparency, and the adequacy of TOS.

Why It Matters Today

Highlights the tension between hyper-personalization and consumer trust. Serves as a caution for AI-driven lifecycle targeting which is still a privacy concern in a GDPR/CCPA era. Teaches modern marketers about ethical context and consent in data activation.

3 Takeaways

  • Personalization must respect boundaries. Accurate predictions can feel invasive without permission.
  • Transparency is essential. Disclose data usage to maintain trust.
  • Use camouflage sparingly. Mixing targeted and non-targeted content reduces perceived intrusion, but consent trumps camouflage.

Notable Quotes and Data

  • “Target calculated the girl was pregnant by combining data from individual purchases across approximately 25 product categories.”
  • “Target then began interlacing baby product coupons … with coupons for lawn mowers and other random items to avoid the perception that they are spying on their customers.”

Full Case Narrative

In early 2010, Target data scientist Andrew Pole developed a predictive model using baby registry data and purchase histories of products like unscented lotion, calcium, zinc, and magnesium. The goal: detect pregnancy early when purchasing needs change. By assigning each customer a “pregnancy prediction score,” Target could send relevant coupons precisely when the timing aligned with early and mid-pregnancy.

A few years later, journalist Charles Duhigg’s *New York Times Magazine* article detailed an incident where a father discovered his teen daughter’s pregnancy because she received maternity coupons. This narrative went viral under headlines like “How Target Figured Out a Teen Girl Was Pregnant Before Her Father Did.”

After the uproar, Target defended the program, emphasizing that coupon mailers included other products to camouflage sensitive targeting. But the backlash ignited serious debate over privacy, lifespan targeting, and whether TOS consent was sufficient.

Today, marketers view the case as a turning point—an early wake-up call about where personalization meets privacy boundaries.

Timeline

  • 2010: Andrew Pole rolls out pregnancy-prediction model using purchase data from baby registry customers.
  • February 2012: *NYT Magazine* publishes Duhigg’s article; anecdote of teen pregnancy becomes national headline.
  • 2012–2013: Target adds mixed-content mailers to reduce creepiness.
  • Post-2012: Public-private dialogue catalyzes privacy frameworks and regulations.

What Happened Next?

Target continued to refine its analytics with attention to perception, adding unrelated offers to avoid being intrusive. The incident helped spark consumer data bills and frameworks. Predictive personalization persists today, now backed by opt-ins, disclosures, and ethical guardrails.

One Sentence Takeaway

Even the smartest personalization can backfire without transparent consent and respect for customer boundaries.

Sources and Citations

Charles Duhigg, How Companies Learn Your Secrets , New York Times Magazine, February 16, 2012.

Kashmir Hill, How Target Figured Out a Teen Girl Was Pregnant Before Her Father Did , Forbes, February 16, 2012.

Gregory Piatetsky, How Companies Learn Your Secrets , KDnuggets, February 2012.

AIAAIC Incident Repository, Target predicts teen girl pregnancy , AIAAIC, February 2012.

Time, How Target Knew a High School Girl Was Pregnant Before Her Parents Did , Time, February 17, 2012.

Drive Research, How Target Used Data Analytics to Predict Pregnancies , January 8, 2023.

Wikipedia, Target Corporation – Consumer data usage , accessed June 2025.

Case Study: Target’s Personalization Strategy That Went Too Far Read More »

self publishing with amazon ads

Self-Publishing With Amazon Ads by Bryan Cohen Book Summary

Reading Time: 3 minutes

Top Three Quotes

  1. “Amazon ads can help any author grow with incremental improvements. And those small changes make big opportunities for the future.”
  2. “You can’t pay your car loan with a low ACoS, but you can pay it down with higher monthly profit.”
  3. “If you want something to last that long, then you don’t want to rush it.”

Book Theme

Self-Publishing With Amazon Ads is a hands-on, realistic guide for self-published authors to use Amazon Ads strategically to build long-term royalties, develop profitable advertising campaigns, and regain control of their author career.

Why You Should Read This Book

If you’re a self-published author frustrated with marketing methods that drain your time or money, Bryan Cohen’s approach offers sustainable, low-cost, repeatable strategies. This book focuses on mindset, profitability, and the importance of patience in building ad success, making it invaluable for anyone serious about long-term book sales on Amazon.

Key Ideas and Arguments Presented

  • Amazon ads are not a get-rich-quick tactic, but a long-term investment strategy.
  • Lower ad bids often lead to greater profitability than high bids.
  • Success with Amazon ads depends on consistent practice, not one-time hacks.
  • Understanding and targeting relevant keywords is critical for ad visibility and conversion.
  • Sales reporting in the Amazon ad dashboard can be misleading—track royalties and profit separately.
  • Authors must regularly monitor and optimize ad performance rather than set-and-forget.
  • Running ads leads to organic boosts like increased Amazon visibility and recommendations.
  • Learning your genre deeply is essential for ad targeting success.
  • Patience and a test-and-learn mindset are crucial for ad growth.
  • The author provides formulas and benchmarks to determine profitable ad bidding and expected outcomes.

Book Outline

  • Introduction
  • Chapter 1: Why Is It Worth Trying One More Book Marketing Thing?
  • Chapter 2: What Kind of Time Do I Need to Invest in Amazon Ads?
  • Chapter 3: How Do I Set Up Amazon Ads for Maximum Profit?
  • Chapter 4: How Do I Know If My Ads Are Working?
  • Chapters 5–12: Advanced strategies, keyword research, ad dashboard use, genre-based targeting, and more.
  • Epilogue
  • About the Author

Key Takeaways

  • Start slow and aim for profitability over visibility.
  • Target relevant readers rather than broad categories.
  • Use low bids (e.g., $0.39 for series starters and $0.34 for single books) to improve profit margins.
  • Track performance with the KDP dashboard rather than relying only on ad data.
  • Set aside weekly time for keyword research, ad creation, and optimization.
  • Focus your ad spend on your most profitable book first.
  • Relevancy and genre alignment significantly reduce costs.

Key Techniques

  • The Split Screen Method: Compare Amazon Ad Dashboard with KDP Reports for true profit tracking.
  • Low-Bid Strategy: Bid low (under $0.39) to maintain profitability and control costs.
  • Relevancy Targeting: Choose only hyper-relevant books and keywords to train the algorithm.
  • Weekly System: Research keywords, create 5–10 ads weekly, then analyze metrics in 15-minute sessions.

Author’s Qualifications

Bryan Cohen is a bestselling author, founder of Best Page Forward, and host of The Sell More Books Show. He has run Amazon ad workshops for over 30,000 authors and helped many reach over $10K/month in royalties.

Comparison to Similar Books

Compared to other books on Amazon Ads, Cohen’s book is practical, humble, and focused on low-budget long-term growth. It avoids hyped-up promises and emphasizes consistency and mindset, unlike many ad-centric books that push high-risk bidding or short-term tactics.

Target Audience

  • Self-published authors at any stage
  • Writers with limited marketing budgets
  • Authors struggling to understand Amazon Ads
  • Writers ready to commit to long-term growth
  • Authors who’ve tried other ad platforms without success
  • Genre fiction and nonfiction authors looking to scale
  • Those in KDP Select or Kindle Unlimited programs

Critical Response to the Book

The book was well-received, particularly in the indie author community. It was crowdfunded by over 600 authors via Kickstarter, and praised for being honest, approachable, and results-driven. The mix of narrative and instruction keeps it engaging and motivational.

One Sentence Takeaway

Amazon Ads, when used with strategy, low bids, and patience, can transform a self-published author’s career from stagnant to profitable.

Self-Publishing With Amazon Ads by Bryan Cohen Book Summary Read More »

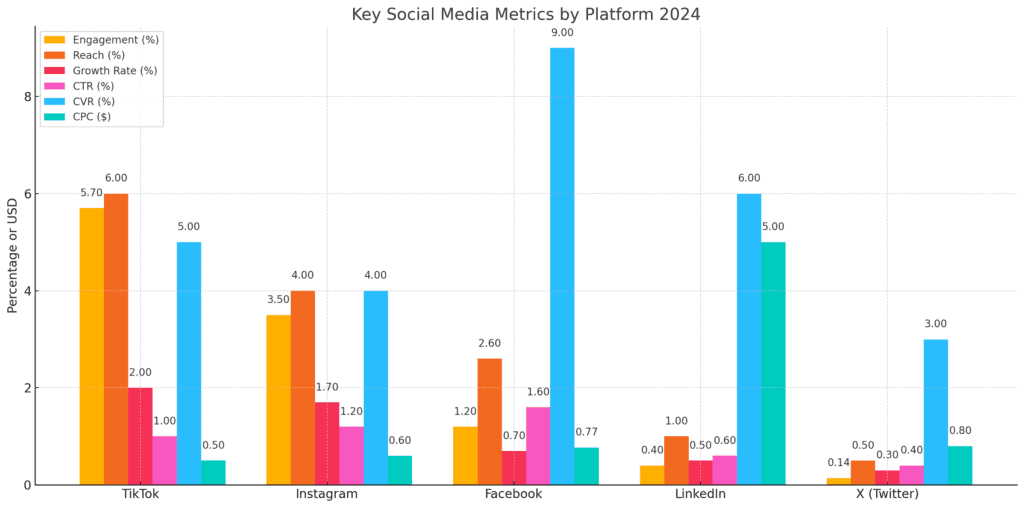
Bar chart showing key social media metrics by platform in 2024, including engagement, reach, growth rate, CTR, CVR, and CPC for TikTok, Instagram, Facebook, LinkedIn, and Twitter.

Top Social Media KPIs That Actually Matter

Reading Time: 6 minutes

How do you know if 100 likes on a post is a lot or a little? The answer lies in context. Key performance indicators (KPIs) are the metrics that matter for social media success, and industry benchmarks give you that all-important context for evaluating your performance.

In today’s rapidly evolving social media landscape, understanding these benchmarks helps marketers set realistic goals and gauge where they stand against the competition. Below is a summary of the top social media KPIs and their average benchmarks using data from 2024, followed by a deeper dive into each metric.

KPI2024 Benchmarks
Engagement RateFacebook ~1.2%, Instagram ~3.5%[1]
X (Twitter) ~0.14%[2], TikTok ~5.7%[3]
Reach Rate (Organic)Instagram ~4.0%, Facebook ~2.6%[4]
Audience Growth Rate (Monthly)Instagram ~1.7%, Facebook ~0.7%, X ~0.3%[5]
Click-Through Rate (CTR)Facebook ads ~1.6% CTR (avg)[6]
Cost Per Click (CPC)Facebook ~\$0.77, LinkedIn ~\$5.00
TikTok/Instagram ~\$0.50–\$0.60[9]
Conversion RateFacebook lead-gen ads ~9%[7]
Generally, >3% is considered good[8]

To help you benchmark your performance more easily, here’s a side-by-side chart of the most important social media metrics by platform—including engagement, reach, growth rates, click-through rates, conversion rates, and ad costs.

Engagement Rate

What it is: Engagement rate measures how actively your audience interacts with your content. It’s usually expressed as the percentage of people who engaged (likes, comments, shares, etc.) out of those who saw the content. Some marketers calculate it as engagements divided by total followers, while others use engagements divided by reach (unique viewers) for a more precise rate.

Why it matters: Engagement rate is a key indicator of content resonance. High engagement means your content is striking a chord with your audience, which in turn can boost visibility via platform algorithms. It’s a comparative metric too—a 2% engagement rate might be average on one platform but excellent on another.

Benchmarks: Engagement levels vary by platform. For example, Instagram’s average engagement rate is around 3.5%, significantly higher than Facebook’s ~1.2%[1]. TikTok leads in this area with roughly a 5%+ engagement rate[3], reflecting its highly interactive user base. By contrast, X (Twitter) sees only about 0.1% engagement on average[2], indicating that interaction is much harder to come by. Keep in mind that overall social media engagement has been on a downward trend for some networks, so creating compelling content is more important than ever to maintain strong engagement.

Reach and Impressions

What it is: Reach is the number of unique users who see your post, whereas impressions count total views (including multiple views by the same user). Essentially, reach answers “how many people saw it?” and impressions answer “how many times was it seen?”

Why it matters: These metrics tell you the size of the audience your content is actually hitting. With algorithms limiting organic exposure, not all your followers will see every post. Tracking reach (often presented as a percentage of your follower count, known as reach rate) helps you understand how content distribution is performing. Impressions can indicate how viral or frequently shared a piece of content became beyond the initial audience.

Benchmarks: Organic reach is notably low across major platforms. On Facebook, an average post might reach only about 2.6% of your page’s followers, and on Instagram around 4.0%[4]. In other words, out of 1,000 followers, only a few dozen may see a given post. This underscores the importance of optimizing content timing and quality to extend reach. Impressions tend to be 1–2x higher than reach on content that gets reshared or viewed multiple times, but reaching even a fraction of your follower base is an achievement under current algorithms. Many brands also utilize paid promotion to combat declining organic reach.

Audience Growth Rate

What it is: Audience growth rate measures how quickly you’re gaining (or losing) followers over time. It’s often expressed as a monthly percentage growth. For example, if you had 10,000 followers and gained 300 in a month, that’s a 3% monthly growth rate.

Why it matters: This KPI reflects your brand’s expanding reach and popularity on social media. A healthy growth rate means your content and social presence are attracting new people consistently. If growth is stagnant or negative, it may signal the need to adjust your strategy or content mix to appeal to new audiences.

Benchmarks: Growth rates on established platforms are generally modest. Across industries, Instagram pages grow by around 1.5–2% per month on average, whereas Facebook pages see closer to ~0.5–0.7% monthly growth[5]. Twitter (X) tends to be slower still, often around 0.3% per month[5]. These are average figures; a strong campaign or viral content can spike your growth well above the baseline (for example, a trending TikTok account might explode with followers in a short time). Comparing your growth rate against these benchmarks helps set realistic expectations. For instance, doubling your followers in a year on a mature platform would be an achievement since it implies ~8% monthly growth sustained over 12 months.

Click-Through Rate (CTR)

What it is: CTR is the percentage of people who click on a link or call-to-action in your social media post or ad. It’s calculated as (clicks ÷ impressions) × 100%. For organic posts, this might apply to links in your content (e.g. “Learn more” or a blog post link). In social advertising, CTR is a critical metric for ad effectiveness.

Why it matters: CTR shows how compelling your content and offers are at driving action. A higher CTR means more of your audience was enticed to “swipe up,” “click the link,” or otherwise engage with your call-to-action. This often translates directly into traffic for your website or landing page. Monitoring CTR helps you gauge the effectiveness of your messaging, creative, and targeting. If impressions are high but CTR is low, your content might not be resonating or the call-to-action isn’t convincing.

Benchmarks: Click-through rates on social content are typically in the low single digits. For example, Facebook ads average around a 1.6% CTR across industries[6]. That means out of 100 impressions, only one or two people click through on average. On organic posts, CTR can vary widely depending on content type (a meme vs. a link post) and platform (links on Twitter often see well under 1% click rates, for instance). Anything above a few percent is usually considered a strong CTR in the social media context. Improving CTR can involve tweaking your copy, visuals, or audience targeting to better entice viewers to take that next step.

Conversion Rate

What it is: Conversion rate is the percentage of users who take a desired action after clicking through your social content. That action could be making a purchase, signing up for a newsletter, filling out a lead form, or any defined goal. In the context of social media marketing, conversion rate often tracks how many of the people who come to your website from social actually convert into leads or customers.

Why it matters: This is the bottom-line metric that connects social media efforts to business outcomes. You might have a million impressions and thousands of clicks, but if none of those clicks convert into meaningful results, the campaign hasn’t delivered real value. Monitoring conversion rate helps you assess the quality of traffic and the effectiveness of your landing pages or social commerce funnels. It also informs ROI calculations for social media marketing.

Benchmarks: Conversion rates vary drastically by platform and industry, but we can look at a few benchmarks. Facebook’s dedicated lead-generation ads, for example, have an average conversion rate around 9%[7] (meaning about 1 in 11 clickers complete the lead form). In contrast, driving eCommerce sales from cold social media traffic will usually see lower conversion percentages. As a general rule of thumb in social media marketing, anything above about 3% is often considered a good conversion rate[8]. Keep in mind that “good” is relative as some industries or campaign types naturally convert at higher rates than others. The key is to track your own conversion metrics over time and strive to beat both your past performance and relevant industry benchmarks.

In summary, knowing these KPIs and their benchmarks equips you to critically evaluate your social media performance. Use these numbers as reference points: if your metrics are lagging far behind industry averages, it’s a signal to refine your strategy, and if you’re exceeding benchmarks, it’s a sign you’re doing something right. But remember—your best benchmark is often your own progress. Improvement over time shows that your strategy is working, even if you’re still catching up to broader averages. By continuously monitoring and comparing your KPIs against both industry standards and your own historical data, you can make informed, data-driven decisions to improve your social media marketing outcomes in 2024 and beyond.

  1. Socialinsider – Social Media Reach: Statistics For 2024.
  2. Brandwatch – Cross-Industry Social Media Benchmarks (2024).
  3. Rival IQ – 2023 Social Media Industry Benchmark Report.
  4. Socialinsider – Social Media Reach: Statistics For 2024.
  5. Brandwatch – Cross-Industry Social Media Benchmarks (2024).
  6. WordStream – Facebook Ads Benchmarks 2024.
  7. WordStream – Facebook Ads Benchmarks 2024.
  8. Shopify – How to Improve Your Social Media Conversion Rate (2025).
  9. WordStream – Facebook Ads Benchmarks 2024.

Top Social Media KPIs That Actually Matter Read More »

pero media type model 2

The Evolution of Marketing Media: Why the PERO Model is the Future

Reading Time: 4 minutes

Marketing has always been about getting the right message to the right audience at the right time, but as the landscape evolves, the way we think about marketing media has shifted. Traditional models like Paid, Earned, and Owned (PEO) helped marketers streamline their strategies. However, as social media platforms and digital ecosystems have grown in influence, there’s now a need for a more comprehensive model. Enter the PERO model: Paid, Earned, Rented, and Owned media.

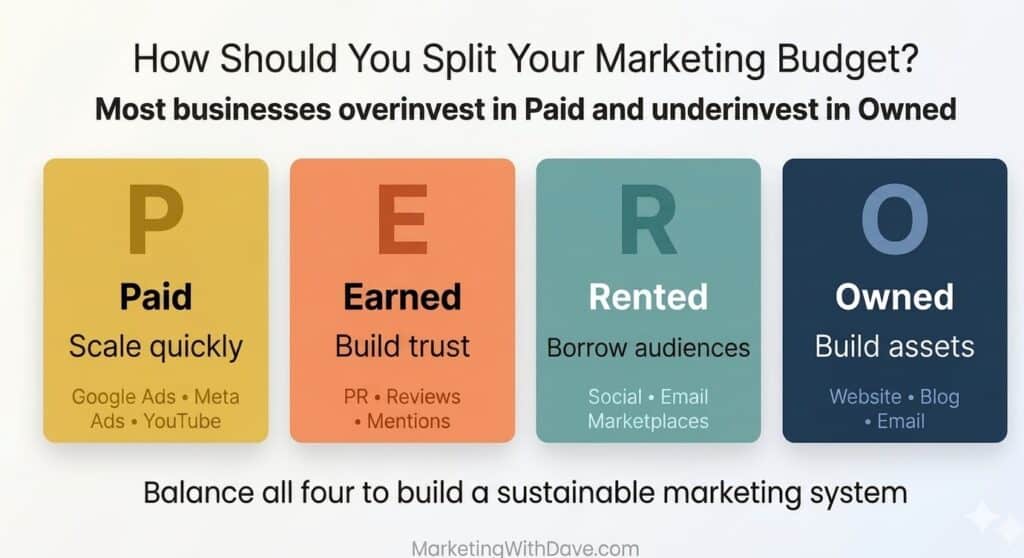
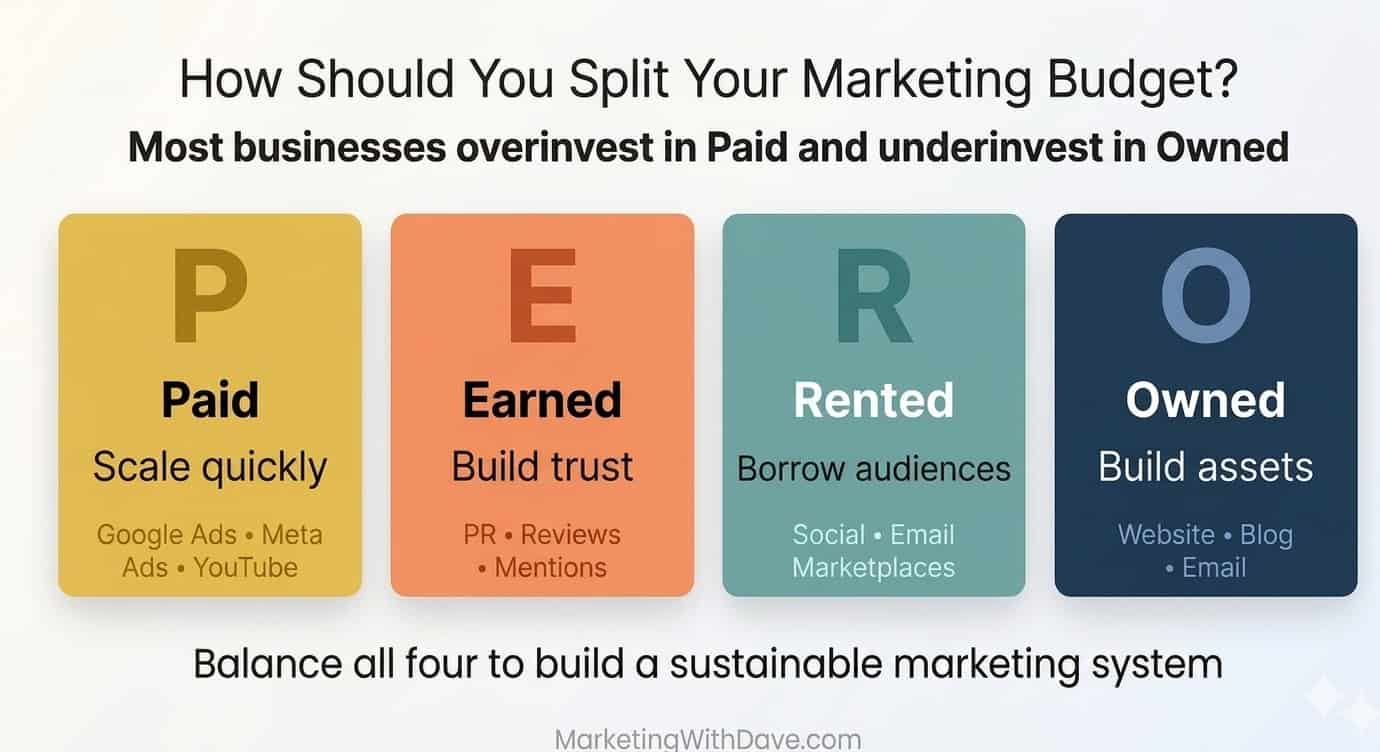
PERO Marketing Media Type Model.

The History of Marketing Media Types

Marketing strategies have long relied on clear distinctions between different types of media. Historically, the Paid, Earned, and Owned model (PEO) served as the backbone for marketers’ media allocation strategies:

  • Paid Media: This includes all forms of advertising that require a budget, such as Google Ads, social media ads, and influencer marketing.
  • Earned Media: Media coverage you earn through organic PR, media mentions, and social media shares. It’s the most credible type of media because it’s not directly controlled by the brand.
  • Owned Media: Content and platforms that you fully control, such as your website, blog, and social media profiles.

As digital and social media platforms grew in prominence, the PESO model (Paid, Earned, Shared, Owned) was introduced by Gini Dietrich to better account for the growing importance of Shared Media, content generated by users and amplified through social interactions. PESO captured how brands should leverage these types of media:

  • Paid Media: Paid advertising, such as Google Ads or social media ads.
  • Earned Media: Media coverage earned through PR, mentions, and organic social shares.
  • Shared Media: Content shared through social media, including organic shares and user-generated content.
  • Owned Media: Content that brands fully control, such as websites and email lists.

PERO takes the PESO framework a step further by adding Rented Media as a distinct category. As social media and digital platforms have grown, brands increasingly rely on these third-party platforms where they ‘rent’ access to large, engaged audiences, making Rented Media a crucial part of modern marketing strategies.

This led to the development of the PERO model, which introduces Rented Media as a distinct category to reflect the increasing reliance on third-party platforms.

  • Paid Media remains the same.
  • Earned Media continues to reflect organic PR and social mentions.
  • Owned Media still refers to what the brand controls.
  • Rented Media was introduced to account for the increasing reliance on third-party platforms where brands rent access to large, engaged audiences without owning the platform. These platforms, such as Facebook, Instagram, and TikTok, allow you to engage with audiences but you don’t control the platform or its data.

The PERO model helps marketers understand the full scope of modern marketing media, balancing long-term investments in Owned media with the more immediate, but sometimes volatile, benefits of Rented media.

Why the PERO Model is a Better Approach

The PERO model offers a comprehensive view of modern marketing media for the following reasons:

  • Inclusivity of Rented Media: With social media platforms, websites, and other third-party services, businesses rent access to vast, engaged audiences. By distinguishing Rented media from Paid and Earned assets, the PERO model helps marketers understand how to strategically use these platforms without becoming overly dependent on them.
  • Balanced Resource Allocation: The model encourages a balanced approach to media allocation. Paid media gives you immediate results, while Earned media builds credibility and Owned media nurtures long-term customer relationships. Rented media serves as a short-term solution to expand your reach.
  • Clarity in Strategy: By separating Rented media from the rest, marketers can treat it as a tool for reaching specific audiences, understanding that it can change or disappear (platform shutdowns or policy changes), unlike owned assets.

Suggested Media Allocation: 40/30/20/10 Breakdown

A common approach to allocating your marketing budget across Paid, Earned, Rented, and Owned media is the following 40/30/20/10 breakdown. This is a starting point and should be adjusted based on your experience, goals, business size, and industry.

Below is a quick reference table that breaks down the most common types of media within the PERO model: Paid, Earned, Rented, and Owned. This will help you understand how different marketing activities fall into each media category, enabling you to better allocate your marketing resources.

PaidEarnedRentedOwned
Google/Bing AdsMedia MentionsFacebook, Instagram, TikTok, YouTube, X (Twitter)Website
Social Media AdsOrganic Social SharesOnline Communities (Facebook Groups, LinkedIn Groups, Reddit)Blog
Display AdsPublic Relations (PR)Influencer Partnerships (on rented platforms)Email List
Sponsored ContentInfluencer MentionsOrganic Social Media Posts (not paid for)Customer Databases
Affiliate MarketingUser ReviewsDisplay Ads on Third-Party SitesMobile App
Remarketing AdsWord-of-MouthSocial Media Engagement (Likes, Shares, Comments on Platforms)Content Libraries
  • 40% Owned Media: Long-term assets like your website, blog, and email list that are crucial for building brand loyalty.
  • 30% Paid Media: Immediate results and conversions through paid ads across platforms like Google and social media.
  • 20% Earned Media: PR, influencer mentions, and organic social media to build credibility and trust.
  • 10% Rented Media: Platforms like Facebook, Instagram, and TikTok offer short-term reach, but remember that control can change.

B2B vs. B2C: Tailoring the Model for Your Business

B2B and B2C companies may adjust these percentages based on their specific goals:

  • B2B: Owned Media (like white papers, case studies, and professional blogs) may take up a larger portion of the budget, while Paid Media may focus on LinkedIn Ads and other professional networks.
  • B2C: Paid Media plays a more significant role, with a higher allocation to ads on platforms like Facebook, Instagram, and Google to drive direct sales.

Flexibility is Key

The PERO model is a flexible framework that can be adjusted based on business size, goals, and market conditions. Continuous testing and optimization of media allocation will allow you to fine-tune your strategy over time.

The Evolution of Marketing Media: Why the PERO Model is the Future Read More »

a historical evolution of social media marketing platforms content and influencers

A Historical Evolution of Social Media Marketing: Platforms, Content, and Influencers

Reading Time: 2 minutes

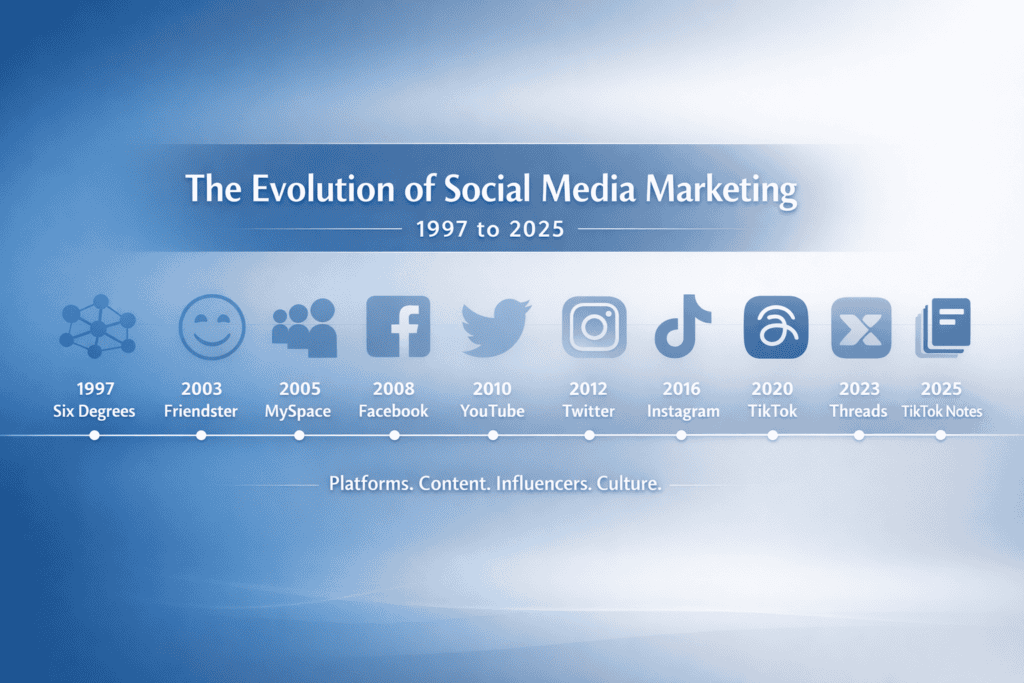
Social media has transformed how people connect, share, and stay informed. From the early days of Six Degrees and Friendster to today’s dominant platforms like Instagram, TikTok, and LinkedIn, each shift has reshaped our digital lives. This timeline highlights the biggest platform launches, viral growth milestones, major acquisitions, and shutdowns that tell the story of social media’s rapid evolution. It is a resource for creators, marketers, and curious minds to reflect on where we have been and where the future may lead.

2025

March – TikTok announces photo-sharing app “TikTok Notes,” aiming to rival Instagram.

January – Meta launches ad-free subscription tiers for Facebook and Instagram in the EU.

2024

October – Twitter is officially rebranded to X under Elon Musk.

April – Bluesky opens to the public as a decentralized social alternative.

March – LinkedIn surpasses 1 billion members globally.

February – BeReal begins sharp user decline, highlighting challenges for trend-driven apps.

2023

July – Threads launches as Meta’s Twitter competitor and gains 100M users in under a week.

2022

October – Elon Musk acquires Twitter, triggering major platform and policy changes.

2020

June – TikTok surpasses 2 billion global downloads.

2019

April 2 – Google+ is officially shut down due to low usage and security concerns.

2018

August – TikTok merges with Musical.ly, rapidly gaining popularity worldwide.

2016

January – Instagram hits 400 million monthly active users.

2013

January – Vine peaks in popularity with short looping videos and viral content.

2012

April 9 – Facebook acquires Instagram for $1 billion.

2011

June 28 – Google+ officially launches as a Facebook alternative.

2010

October 6 – Instagram is launched and gains 1M users in two months.

2009

March – Foursquare launches, bringing gamified check-ins to social media.

2008

May – Facebook overtakes MySpace in monthly U.S. visitors.

2006

March 21 – Twitter launches with its first tweet: “just setting up my twttr.”

2005

February 14 – YouTube is launched, revolutionizing video sharing online.

2004

February 4 – Facebook is launched at Harvard University as “TheFacebook.”

2003

August 1 – MySpace launches, quickly becoming the most visited social site until 2008.

2002

December – Friendster launches, pioneering the modern social networking model.

1997

October – Six Degrees launches, allowing users to list friends and family — often called the first true social network.

A Historical Evolution of Social Media Marketing: Platforms, Content, and Influencers Read More »