hustle hustle boom

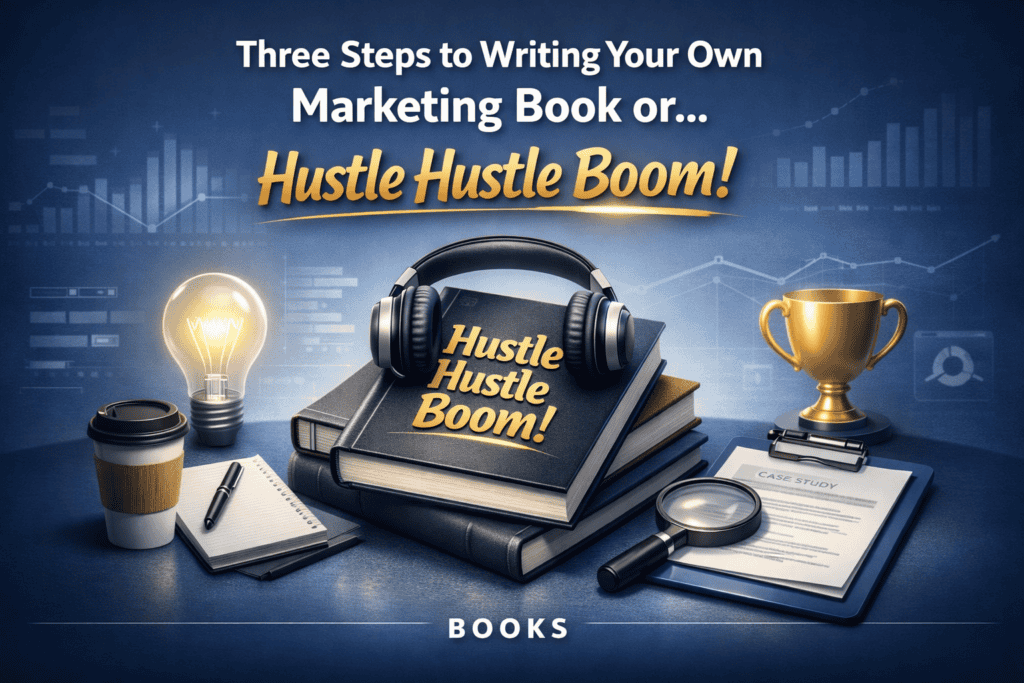
Three Steps to Writing Your Own Marketing Book or… Double H Boom

Reading Time: 3 minutes

Reader Beware: Any blog post tagged as “Data Driven David” may not be as related to marketing as most of my content. I truly love data and love it even more when it is well visualized and wrapped in a great story — now, that’s good marketing.

Before we begin, a quick disclaimer: If you came here expecting actionable value like most of my content, brace yourself—this one leans more on the satirical side (but who knows, you still might walk away with a book idea).

I hit a fairly significant nerd achievement in 2024. I read my one-thousandth book. I can hear my oldest daughter’s voice in my head now saying, “Those don’t count.” So, let me add an asterisk—most of them were audiobooks. Hopefully, you don’t think less of me now.

Most of these books have been marketing or business books. If the title includes the words “analytics,” “data,” or “metric” … here’s my credit card.

I’ve read—or listened to—enough of these books that I’ve cracked the code. I’ve thought about this for too long and it’s time that the secret be unleashed. I’m going to share with you the three-step recipe for writing your own marketing book.

Yep, in just three steps.

Step #1: Find a Clever-Sounding Word or Phrase

This is the foundation of your book. A single word or short phrase that sounds profound and slightly mysterious. A few examples from existing titles:

  • Grit
  • Slight Edge
  • Atomic Habits
  • Radical Candor

Twenty-second time-out. Although you might think I’m taking a jab at these books, I enjoyed each of them. Just using them as examples.

Okay, time back in.

No reason to make this harder than it needs to be. I asked ChatGPT for some ideas, and here’s what it came up with:

  • Bare Minimum Magic – For those who like to do just enough and still make it work.
  • Almost Hustle – Like full hustle, but with built-in nap breaks.
  • Hustle Hustle Boom – Wow. We have a winner.

It’s got everything—repetition for emphasis, action-packed energy, and an ending that makes it sound like something truly revolutionary (or a wrestling move).

Step #2: Find Some Marketing Case Studies

Now that we have our magic phrase, the next step is to find case studies that “prove” it’s the reason for success. Because when you control the narrative, everything conveniently aligns.

Let’s look at a popular marketing case study:

Clayton Christensen, one of my marketing heroes who tragically passed away on my birthday 1/23/2020, and a business consultant at Harvard. You may be familiar with his story about refusing to play in the basketball finals tournament because it was held on Sunday. He was the Center for Oxford standing at 6’8”.

He was hired by McDonald’s to find out why people bought their milkshakes. He and his team observed that about half of all milkshakes were sold before 8:30 AM, typically to solo customers who bought nothing else.

So, what were they really “hiring” the milkshake for?

The alternatives weren’t cutting it. A donut? Too messy. A bagel? Dry and awkward to eat while driving as you must have cream cheese. A Snickers? Induced guilt. A banana? Gone too fast.

The milkshake, however, lasted a full 20-minute commute—delivered through a straw, keeping hands clean, and making the drive slightly less miserable.

And there you have it. If Clayton and his team hadn’t put in the Hustle Hustle Boom, they never would have uncovered the real job of McDonald’s morning milkshakes—keeping solo commuters occupied during their long drives.

But their research didn’t stop there. In the afternoon, the milkshake had a completely different job. Moms buying them for their kids didn’t want to sit around forever waiting for them to finish, so McDonald’s had to make these shakes less thick to speed things up. Same product, two very different jobs—all discovered because of the relentless drive to dig deeper.

Step #3: Write the Rest of the Book

You’ve probably seen that meme on how to draw an owl:

Step 1: Draw some circles.
Step 2: Draw the rest of the damn owl.

Well, that’s basically Step 3. Just write the book. Fill in the gaps, stretch some anecdotes, add a framework or two, and—Double H Boom—you’re an author.

And don’t forget the most important part: selling a high-priced online course about it.

You’re welcome.

Three Steps to Writing Your Own Marketing Book or… Double H Boom Read More »
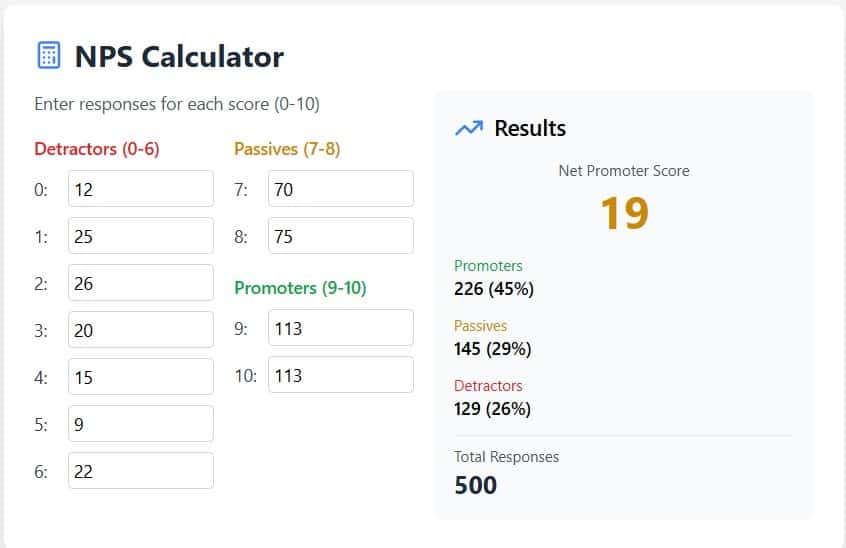
NPS calculator showing responses and results for Net Promoter Score analysis with a score of 19.

5 Powerful Insights from Analyzing Net Promoter Score (NPS) Survey Data

Reading Time: 4 minutes

In a previous blog post—Best Questions to Include in Your Customer Satisfaction Survey—I outlined the most effective questions to ask when measuring customer satisfaction. One of the most common and impactful questions is the Net Promoter Score (NPS) question:

“How likely are you to recommend [Company/Product/Service] to a friend or colleague?”

Since many businesses rely on NPS to gauge customer loyalty, it’s essential to move beyond just collecting responses and dive into analyzing the data for actionable insights. In this post, I’ll share 10 key insights you can uncover when you analyze your NPS survey data—and provide examples of how to interpret the results.

To illustrate these insights, I’ll use a fictitious company called Fairway to Heaven Golf, which sells drivers, irons, and putters to men, women, and youth. Our sample dataset includes 500 customer responses, offering a rich foundation for analysis.

1. Filter by Customer Type

Segmenting your NPS survey results by customer type is one of the most powerful ways to uncover actionable insights. Each customer type represents a distinct group with unique needs—often aligning with specific products or services you offer.

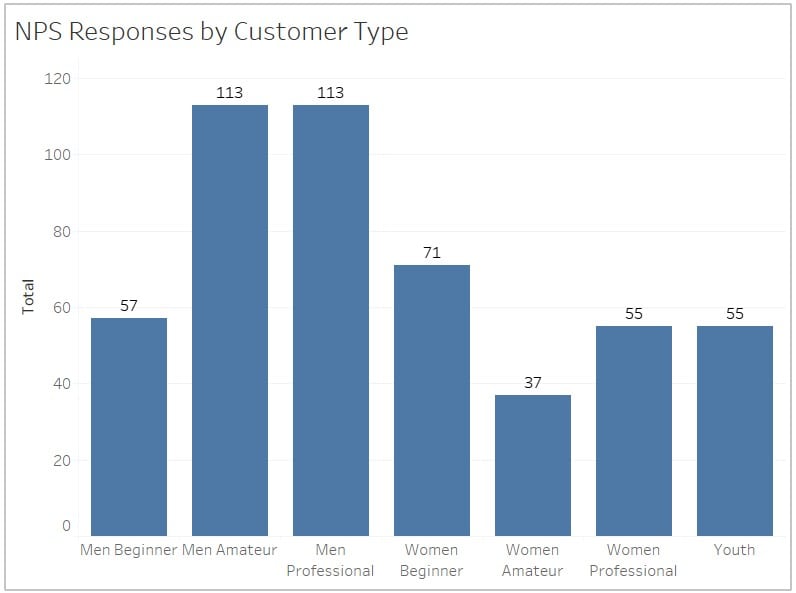
In our Fairway to Heaven Golf example, we’ve identified seven customer types, as shown in the graph below. While the number of survey responses for each type may not mirror your overall customer distribution, this breakdown raises immediate questions:

  • Why was one customer segment less responsive?
  • Do we need more responses from certain segments to ensure a valid sample?

By filtering responses by customer type, you can identify which groups are your strongest promoters—and which may need targeted improvements to enhance their experience.

#2 Understand How NPS is Measured

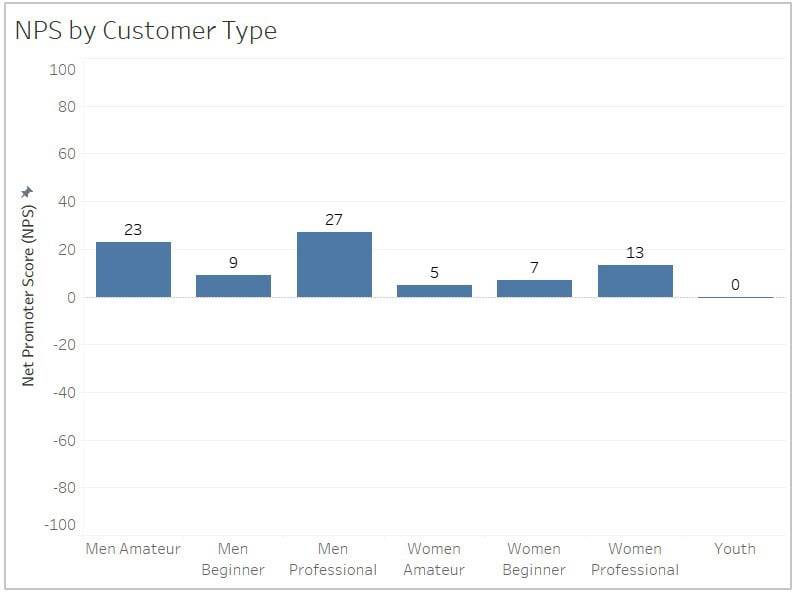
It’s common to look at companies like USAA and Apple who have an NPS in the 70s and think your company should be receiving a similar score. For our fictitious golf equipment company, you can see their NPS rating by each customer type. At first glance, this graph may look odd, but keep in mind that the NPS can range from -100 to 100. Companies that report their NPS publicly often ensure that a third party conducts the survey to maintain objectivity and credibility. Proper NPS surveys also follow best practices—such as surveying a representative sample, ensuring anonymity, and asking the question consistently across customer touchpoints.

3. Segment Your Customer Type by NPS Categories

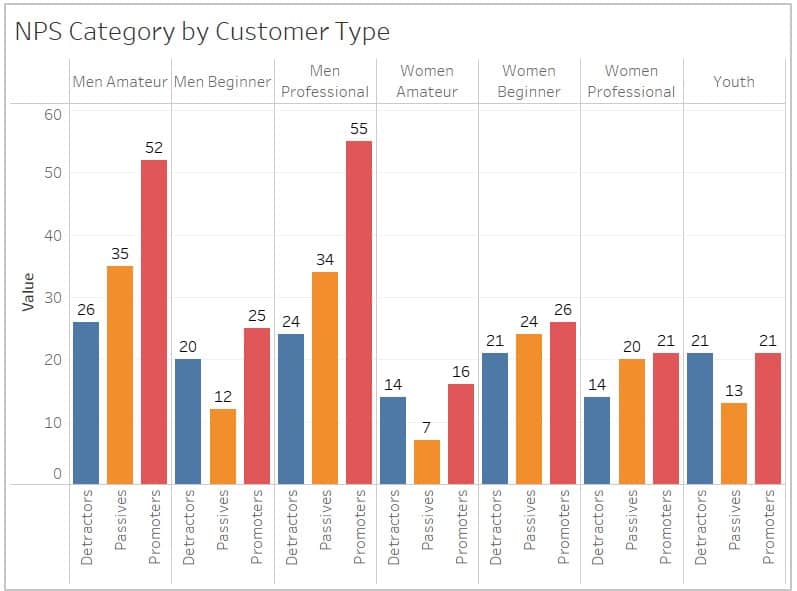
You’ve already seen the value of segmenting your NPS data by customer type. The next level of segmentation is breaking it down further by NPS category. An NPS score ranges from 0 to 10, which is divided into three categories: Promoters (9-10), Passives (7-8), and Detractors (0-6). The chart below makes it easy to identify each of these groups.

#4 Understand the Impact of Detractors and Passives

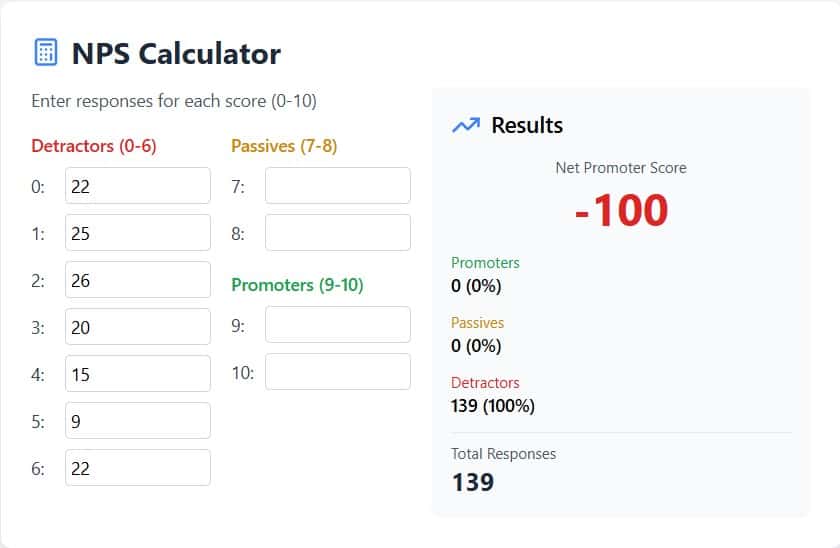
You can calculate your NPS and experiment with the numbers using my NPS calculator.

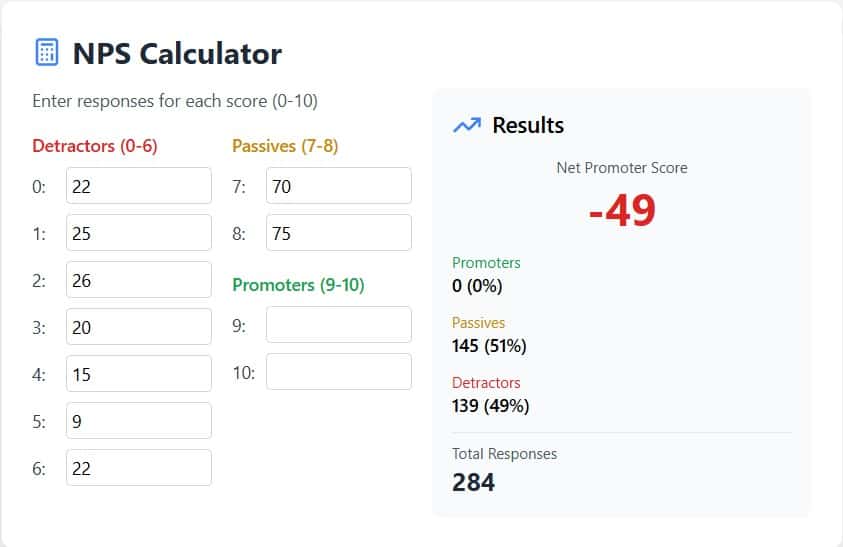
In the first screenshot, notice how, by entering only Detractor scores (those from 0-6), the NPS results in -100. This makes sense, as there are no Promoters to offset the Detractors. Without any Passives or Promoters, your NPS will always be negative if there are enough Detractors.

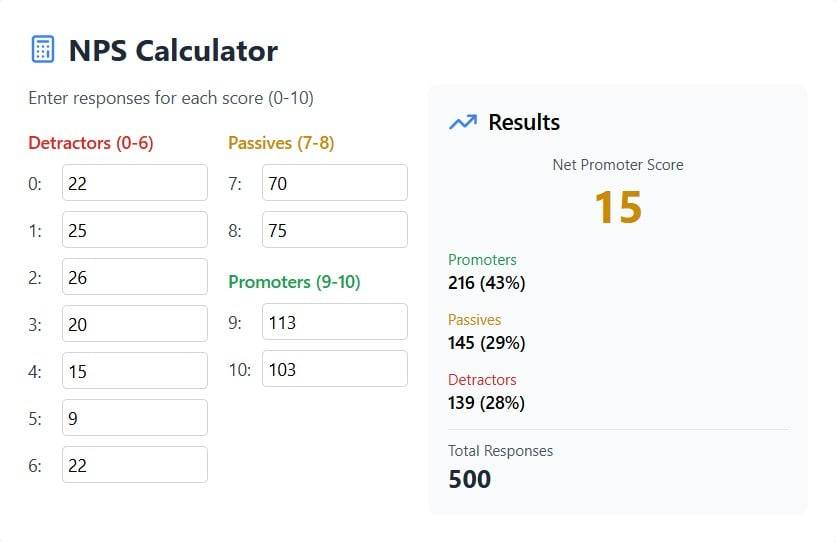
Passives also don’t directly affect the NPS calculation formula, but they do influence the percentage calculations as you can see in the second screen show below. When you add more Passives, it changes the total number of respondents and alters the percentages of Promoters and Detractors relative to the overall sample size. This ultimately shifts the final NPS result. Finally, the third screen shot shows the NPS for Fairway to Heaven Golf including all Detractors, Passives, and Promoters.

Just remember, the NPS calculation formula is: NPS = % of Promoters – % of Detractors

#5 Converting Detractors and Passives

One of the nice things about this NPS calculator is how easy it is to perform real-time what-if analysis. What would be the impact if 10 Detractors became Passives? Would that differ from 10 Passives becoming Promoters? The math for both of these scenarios is the same: your NPS increases from 15 to 17. However, if 10 Detractors become Promoters, this results in your NPS increasing to 19, as shown in the screenshot below.

By understanding and applying these five powerful insights, you can transform your NPS survey data from just numbers into actionable strategies that directly improve customer satisfaction and loyalty. Segmenting by customer type and NPS categories, understanding the impact of Detractors and Passives, and exploring how changes in these groups affect your overall NPS will give you a deeper understanding of where to focus your efforts. Whether it’s addressing the needs of specific customer segments or strategically converting Detractors into Promoters, each of these insights empowers you to take concrete steps toward creating a better customer experience.

5 Powerful Insights from Analyzing Net Promoter Score (NPS) Survey Data Read More »

ai agents explained

AI Agents Explained: Key Distinctions and Marketing Use Cases for Business Leaders

Reading Time: 3 minutes

AI agents are poised to transform how businesses operate and how we interact with technology. According to a report by McKinsey & Company, the AI market is projected to deliver up to $13 trillion in additional global economic activity by 2030. Microsoft CEO Satya Nadella predicts that “AI agents will become the primary way we interact with computers in the future.”

Understanding the nuances of AI agents is essential for any business leader aiming to stay ahead in this rapidly evolving landscape.

In the book AI Agents Explained for Business Leaders by David M. Patel, six critical distinctions in AI agent design are explored. These distinctions highlight the diverse capabilities, applications, and trade-offs organizations must consider when integrating AI into their operations.

1. Task-Specific vs. General-Purpose Agents

Task-Specific Agents: These agents are designed to perform a single function efficiently. For example, a chatbot handling customer support inquiries is a task-specific agent tailored for a specific purpose.

General-Purpose Agents: These are more flexible and capable of performing various tasks across different domains. For instance, virtual assistants like Siri or Alexa can handle scheduling, answer questions, and control smart home devices.

2. Reactive vs. Proactive Agents

Reactive Agents: These respond to stimuli or commands but lack the ability to predict future needs. An example is a spam filter that reacts to incoming emails and classifies them based on their content.

Proactive Agents: These anticipate needs and act accordingly. For example, an AI-powered recommendation engine on an e-commerce platform proactively suggests products based on user behavior.

3. Learning vs. Static Agents

Learning Agents: These improve their performance over time by analyzing new data. For instance, a personalized marketing AI can refine its customer targeting as it gathers more purchase history.

Static Agents: These operate with fixed rules and do not adapt over time. A rule-based chatbot using predefined responses is an example of a static agent.

4. Physical (Embodied) vs. Virtual Agents

Physical Agents: These exist in the physical world, such as autonomous delivery robots navigating urban environments.

Virtual Agents: These exist purely in digital spaces, like AI-powered virtual customer assistants interacting through websites or apps.

5. Single-Agent vs. Multi-Agent Systems

Single-Agent Systems: These involve a solitary AI performing a task independently, such as a virtual assistant handling voice commands on a smartphone.

Multi-Agent Systems: These involve multiple AI agents working together. For example, autonomous vehicles in a delivery fleet communicate to optimize routes and reduce delays.

6. Autonomous vs. Human-AI Collaborative Agents

Autonomous Agents: These operate without human intervention. An autonomous drone delivering packages independently falls into this category.

Human-AI Collaborative Agents: These work alongside humans, enhancing productivity. For example, AI-powered medical diagnosis tools assist doctors in analyzing patient data and suggesting potential treatments.

Why These Distinctions Matter

Understanding these distinctions helps business leaders make informed decisions when implementing AI solutions. By choosing the right AI agent type, organizations can enhance efficiency, reduce costs, and stay competitive in the age of artificial intelligence.

AI Agent Use Cases in Marketing:

As a digital marketer, I found these AI agent use cases particularly valuable for enhancing marketing efforts and improving customer engagement.

1. Personalized Content Creation

Generate tailored email campaigns, social media posts, and product recommendations by analyzing customer data such as browsing behavior, purchase history, and engagement patterns.
Example: An AI agent can craft personalized emails with product suggestions based on past purchases.

2. Customer Behavior Analysis

Track user activity across websites and social platforms to identify patterns, predict trends, and assign lead scores for better audience targeting.
Example: AI agents monitor web page visits and assign lead scores to prioritize high-potential customers.

3. Campaign Analytics and Optimization

Extract, process, and analyze large datasets to identify key patterns, measure performance metrics (e.g., click-through and conversion rates), and recommend campaign improvements.
Example: An AI agent tracks engagement rates and suggests optimized messaging for better ROI.

4. Automated Social Media Management

Assist with content scheduling, audience targeting, and sentiment analysis while providing real-time feedback to improve future posts.
Example: AI agents identify trending topics and automatically post optimized content for better engagement.

5. eCommerce Support

Manage inventory, predict restocking needs, and offer personalized product recommendations to boost sales and ensure seamless customer experiences.
Example: AI agents update inventory in real-time during high-traffic shopping seasons.

6. Decision Support for Marketing Teams

Analyze data, suggest strategies, and provide actionable insights while leaving final decision-making to human marketers.
Example: AI agents suggest target audience segments based on historical campaign data.

7. Enhanced Customer Experiences

Deliver relevant, engaging content at scale, improving customer satisfaction and increasing loyalty.
Example: An AI agent anticipates customer questions and provides proactive, personalized support.

AI Agents Explained: Key Distinctions and Marketing Use Cases for Business Leaders Read More »

owala marketing five cs analysis

Marketing 5 C’s Analysis for Owala Water Bottles

Reading Time: 3 minutes

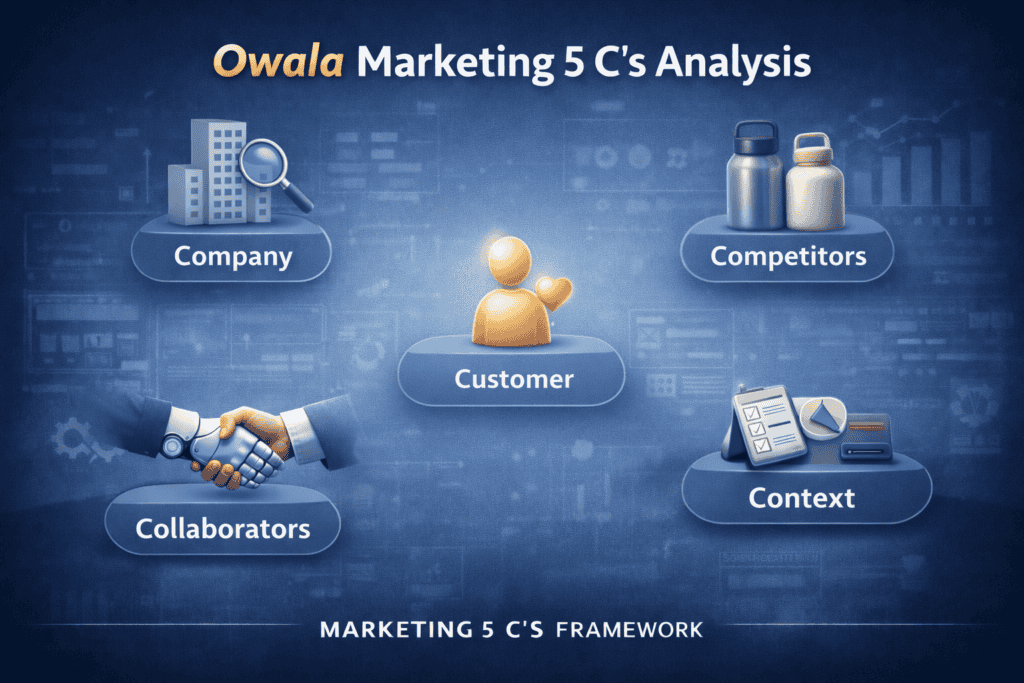
Similar to the Owala SWOT analysis I previously performed, this article evaluates the Owala brand using the Marketing 5 C’s framework:

  • Company
  • Customer
  • Collaborators
  • Competitors
  • Context

Often, there were items from the SWOT analysis that could also have been added to the 5 C’s, but those were largely ignored to avoid repetition and redundancy. The Marketing 5 C’s framework provides a comprehensive view of a brand’s internal and external environment, offering actionable insights for growth and strategic positioning. By applying this framework to Owala, we can better understand their strengths, weaknesses, and the opportunities and threats they face in the competitive reusable drinkware market.

I chose Owala for this analysis because they are an exciting, fast-growing brand that stands out with innovative product designs. Plus, as a Utah-based company, they represent a local success story that is making waves in the competitive reusable drinkware market.

1. Company

Strengths:

  • Clear brand identity focused on making life easier and more enjoyable.
  • Strong product positioning against competitors like Stanley—offering designs that are neither overkill nor underwhelming.
  • Innovative product features (e.g., FreeSip technology) that differentiate Owala in a crowded market.
  • Playful and bold brand voice resonates with their target demographic, especially through creative product names and marketing.

Weaknesses:

  • Newer brand in a saturated market with established competitors like Hydro Flask, Yeti, and Stanley.
  • Faces similar operational challenges (e.g., supply chain risks, international expansion) as other U.S.-based brands.
  • Positioning as a lifestyle brand may alienate more utilitarian consumers seeking no-frills, functional designs.

2. Customer

Strengths:

  • Appeals to young, active, health-conscious consumers who value unique, vibrant designs.
  • Positioned to capture trend-focused buyers looking for functional yet stylish drinkware.

Weaknesses:

  • Low customer loyalty—this demographic is easily drawn to the next “cool” product.
  • May struggle to retain customers if product innovation slows or competitors launch trendier designs.
  • Focus on younger consumers may overlook other lucrative demographics (e.g., professionals or older adults)

3. Collaborators

Internal:

  • Innovative R&D team with a track record of creative, user-friendly designs.
  • Company culture reflects its core audience—young, active, and fun—which informs product design and marketing.
  • Innovative culture provides a competitive edge but requires ongoing investment in product development to maintain market leadership.

External:

  • Reliable manufacturing partners in China keep costs competitive, though supply chain disruptions (e.g., due to global events) remain a risk.
  • Potential to deepen relationships with key retailers or collaborate with lifestyle brands to increase market presence.
  • Opportunity to partner with fitness or wellness apps for cross-promotion, especially if pursuing smart hydration products.

4. Competitors

Opportunities:

  • Continue innovating to stay ahead of copycat products (e.g., enhancing FreeSip or developing new technologies).
  • Explore new customer segments (e.g., athletes, environmentally conscious consumers, older demographics).
  • Expand through new retail partnerships and international markets.
  • Tap into corporate gifting and custom branding for business clients, similar to competitors like Yeti.

Threats:

  • Highly competitive and saturated market where new entrants can quickly gain traction.
  • Larger competitors (e.g., Yeti, Stanley) have stronger brand equity and resources for rapid innovation and distribution.
  • As brand awareness increases, the risk of counterfeits and knock-offs also grows.

5. Context

Opportunities:

  • Capitalize on smart hydration trends—develop smart bottles that sync with health apps.
  • Align with sustainability movements by emphasizing reusable, eco-friendly materials.
  • Communicate ethical sourcing and fair labor practices to align with consumer demand for transparency.

Threats:

  • Navigating strict compliance with FDA regulations and BPA-free standards.
  • Consumers demand safe, durable, and sustainable products—any perceived compromise could harm brand trust.
  • Changing consumer preferences, such as a shift toward minimalism or multi-use products, could challenge Owala’s vibrant, design-first approach.

Marketing 5 C’s Analysis for Owala Water Bottles Read More »

swot analysis vs the five cs framework

The 5 C’s of Marketing: A Smarter Approach to Situational Analysis

Reading Time: 3 minutes

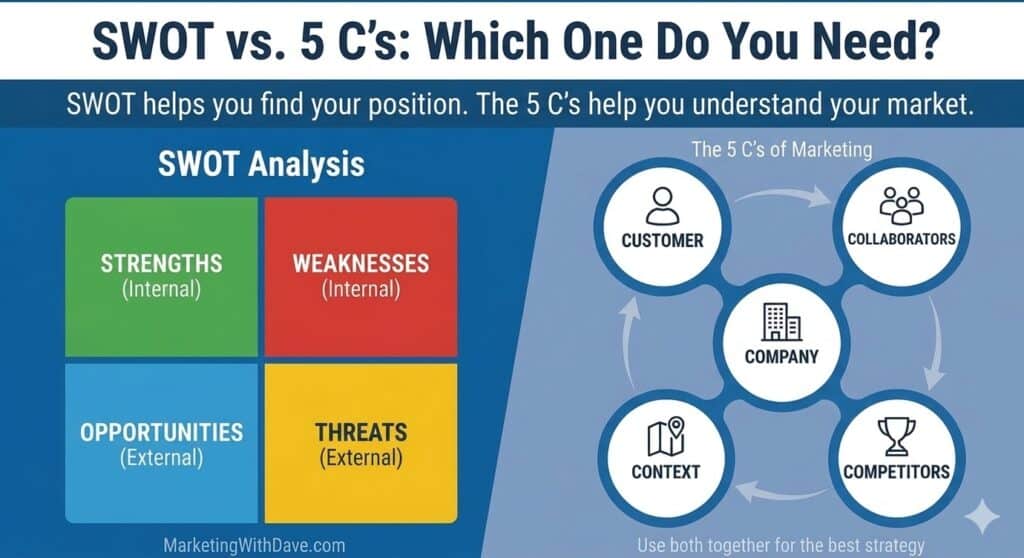
When crafting a marketing strategy, understanding your business environment is critical. Two popular frameworks—SWOT analysis and The 5 C’s of Marketing—help you assess internal and external factors. While SWOT analysis focuses on strengths, weaknesses, opportunities, and threats, the 5 C’s—though not attributed to a single individual—offer a broader, more dynamic perspective. Here, we’ll explore the 5 C’s in detail and compare them to SWOT to highlight their unique value.

What Are the 5 C’s of Marketing?

The 5 C’s framework provides a comprehensive analysis of five critical areas influencing your marketing strategy:

  • Company – What is your company like? This examines internal strengths and weaknesses, including your brand, resources, and unique capabilities.
  • Customer – Who are your customers? This includes both current customers (strengths and weaknesses) and potential customers (opportunities and threats). Understanding their needs and behaviors is essential.
  • Collaborators – Who supports your business? This includes internal and external partners—suppliers, distributors, agencies—who contribute to your success.
  • Competitors – Who else is in the market? Competitors present both opportunities (e.g., mergers) and threats (e.g., market share loss). Analyzing their moves helps you stay ahead.
  • Context – What external factors affect your business? This involves trends, regulations, and broader environmental forces shaping opportunities and risks.

How Do the 5 C’s Compare to SWOT Analysis?

SWOT analysis is widely used due to its simplicity. It categorizes business realities into four quadrants:

  • Strengths – Internal advantages to leverage
  • Weaknesses – Internal limitations to address
  • Opportunities – External chances to grow
  • Threats – External risks to mitigate

The 5 C’s overlap with SWOT but offer a more nuanced view:

  • Company: Similar to SWOT’s internal strengths and weaknesses.
  • Customer: Unlike SWOT, the 5 C’s directly emphasize understanding both existing and potential customers. SWOT struggles to categorize customers clearly.
  • Collaborators: The 5 C’s identify internal and external partners, which SWOT typically does not address explicitly.
  • Competitors: Both frameworks examine competitors, but the 5 C’s consider them as both threats and potential opportunities (e.g., acquisitions).
  • Context: This mirrors the external focus of SWOT’s opportunities and threats but with a broader lens on environmental forces.

What SWOT Misses: The Customer Factor

A key limitation of SWOT analysis is its vague handling of customers. Are customers part of your internal environment (strength/weakness) or external (opportunity/threat)? This ambiguity can overlook critical insights like unmet customer needs or emerging segments. The 5 C’s resolve this by giving customers a distinct focus.

Action-Oriented Insights: Match and Convert

One advantage of SWOT is its action-oriented mindset. Two things a business should focus on with its SWOT matrix:

  • Match: Align internal strengths with external opportunities. For example, if your company has a strong brand (strength) and a rising demand exists (opportunity), you can combine these for growth.
  • Convert: Turn weaknesses into strengths and threats into opportunities. For instance, improving slow customer service (weakness) can become a competitive advantage.

Why Use Both Frameworks?

While SWOT provides a simple, high-level view of both internal factors (strengths and weaknesses) and external factors (opportunities and threats), the 5 C’s offer a more detailed exploration, particularly of key relationships such as those with customers, collaborators, and competitors. The 5 C’s also provide a framework for understanding the broader context in which a business operates. By combining both frameworks, you gain a more nuanced analysis that balances internal capabilities with external dynamics, leading to a more comprehensive marketing strategy.

By applying these frameworks together, you gain a holistic view of your business environment—empowering smarter, more adaptable marketing strategies.

The 5 C’s of Marketing: A Smarter Approach to Situational Analysis Read More »

linkedin your social selling index ssi 1

What’s Your LinkedIn Social Selling Index (SSI)

Reading Time: 2 minutes

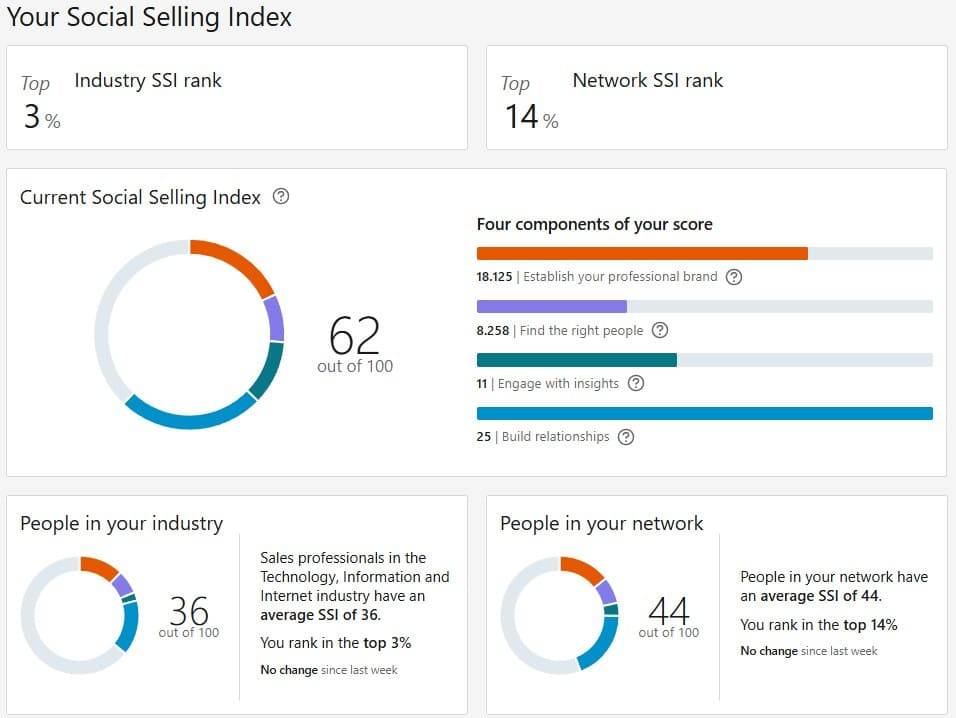
Did you know LinkedIn provides a free Social Selling Index (SSI) to help you measure your effectiveness on the platform? Updated daily, your SSI score evaluates how well you’re leveraging LinkedIn across four key areas:

  • Establishing your professional brand – Are you optimizing your profile and sharing valuable content?
  • Finding the right people – Are you strategically connecting with relevant professionals?
  • Engaging with insights – Are you interacting with content in meaningful ways?
  • Building relationships – Are you nurturing connections and growing your network?

Your SSI score ranges from 0 to 100, and a score of 70 or higher is considered strong. In fact, LinkedIn reports that top social sellers tend to score above 75, significantly outperforming those with lower scores in terms of sales success and engagement.

Additionally, your SSI dashboard allows you to compare your score to others in your industry and network, providing useful benchmarks. Here’s a look at my own SSI score:

To check your own SSI, visit: LinkedIn SSI Dashboard

How to Improve Your LinkedIn SSI Score

If your score isn’t where you’d like it to be, here are some actionable ways to boost it:

  • Optimize Your Profile – Ensure your headline, summary, and experience sections highlight your expertise. Use a professional photo and a compelling background banner.
  • Share Valuable Content – Post industry insights, personal takeaways, and helpful resources regularly.
  • Engage with Others’ Content – Comment thoughtfully, react, and share posts to stay active in discussions.
  • Connect Strategically – Send personalized connection requests and build a meaningful network rather than just growing numbers.
  • Use LinkedIn’s Search Tools – Leverage advanced search to find and connect with the right professionals.

A strong SSI isn’t just about a number—it’s a reflection of how well you use LinkedIn to build authority, engage meaningfully, and strengthen professional relationships.

What’s your current SSI score? Share your insights in the comments!

What’s Your LinkedIn Social Selling Index (SSI) Read More »