Social

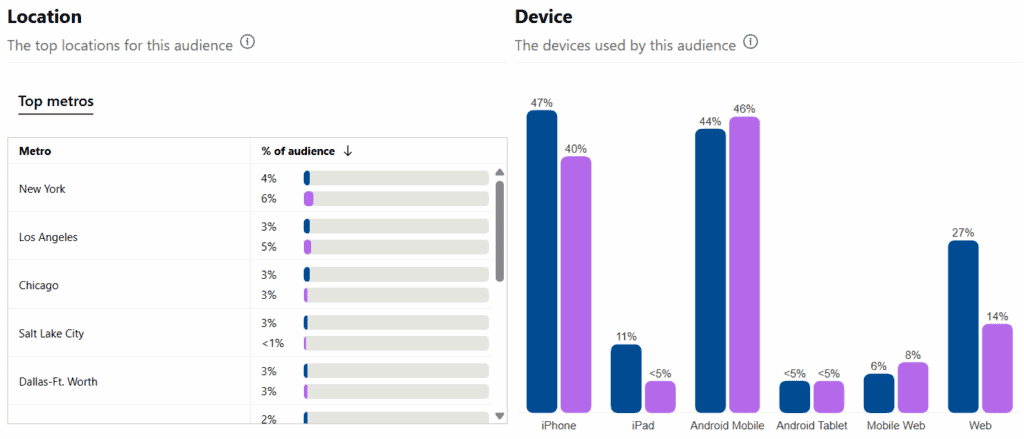
Graph showing Pinterest audience engagement metrics by location and device, highlighting top metros and device usage percentages for marketing insights.

Who’s Engaging With Your Pins? A Guide to Pinterest Audience Insights

Reading Time: 3 minutes

If you missed it, my earlier Pinterest post covered the analytics and metrics available when you convert your profile to a business account. Oh, and it’s free so there are zero downsides.

In this post, I’m diving into the Audience Insights section of Pinterest Analytics. This is a powerful but often overlooked tool for advertisers and content creators.

Where to Find Pinterest Audience Insights

Visit Pinterest Audience Insights and you’ll be greeted with three viewing options:

  • Your Business (for me, that’s Nelson Nexus)
  • All Pinterest users
  • Combined

The metrics are the same across each tab. You’re just choosing which audience you want to analyze.

Each tab includes two breakdowns:

  • Total Audience: Users who have seen or engaged with your Pins in the last 30 days.
  • Engaged Audience: Users who have engaged with your Pins (saved, clicked, etc.) in the last 30 days.

Note: The date range is fixed at 30 days. There is currently no way to adjust this.

What’s in the CSV Export and How You Can Use It

You can export your insights to CSV. While it’s an aggregated report, there is quite a bit to unpack. The export includes the following columns:

  • Category and Bulk Sheet Category: General interest areas (e.g., Food and Drink, Home Decor, Women’s Fashion).
  • Percent of Audience: How much of your audience falls into that category.
  • Affinity: A key metric that shows how much more likely your audience is to engage with that interest compared to the general Pinterest audience.
  • Interest and Bulk Sheet Interests: More specific niches under the broader categories.

Use Cases for the CSV Data:

  • Creative Targeting: See what your audience cares about most and tailor content or ads accordingly.
  • Content Planning: If a large percent of your audience has an affinity for “Meal Prep,” it may be time for more recipe Pins.
  • Audience Comparison: Filter by category or sort by highest affinity to uncover underserved interest areas.
  • Keyword Expansion: Discover niche interests to use in Pinterest SEO or ad targeting.

What does affinity mean?
Affinity is a relative score. For example, an affinity of 3.0 means your audience is three times more likely to engage with a specific interest than the average Pinterest user. This helps you prioritize content that truly resonates.

Audience Charts You’ll Find in the Dashboard

Pinterest also includes a few simple but powerful visualizations:

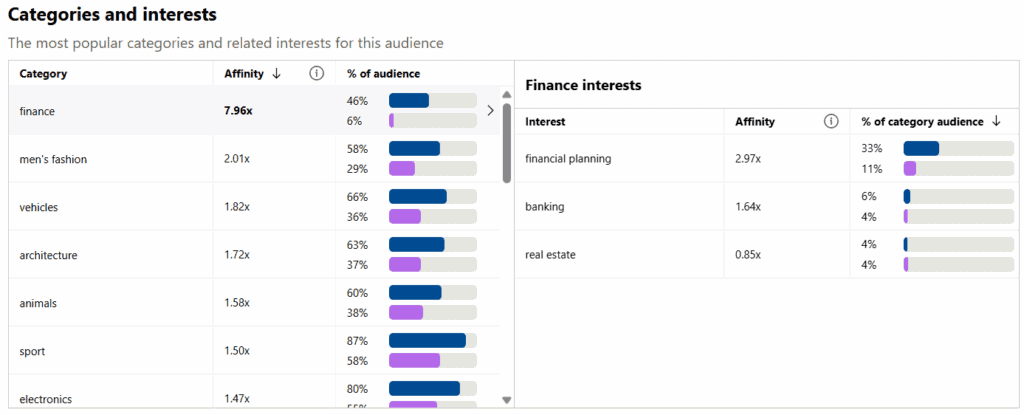
  • Categories and Interests: Bar chart showing which topics dominate your audience.
  • Age: Breakdown of users by age bracket (18–24, 25–34, etc.).
  • Gender: Percentage of your audience identifying as female, male, or unspecified.
  • Location: U.S. states ranked by percentage of your audience.
  • Device: See if your audience uses iPhone, Android, web, or tablet most often.

Below are examples of each chart to help you visualize the type of data Pinterest provides. While you can view insights for your business, the general Pinterest audience, or a combination of both, the charts shown here display my engaged audience side by side with Pinterest’s overall engaged audience. This comparison view helps illustrate how your audience differs from the broader platform trends.

Why This Matters for Marketers and Advertisers

Pinterest Audience Insights is built with advertisers in mind. Here’s how to extract more value from it:

  • Target Smarter: Use the affinity and category breakdowns to align your ad targeting with actual behavior.
  • Spot Gaps: Is your audience heavily skewed to one age group or gender? Adjust your content strategy or expand your reach.
  • Localized Content: Knowing where your audience is concentrated may impact seasonal or regional creative choices.
  • Test with Confidence: Combine high-affinity interests with new ad formats to test what works. For example, if “DIY” scores high, try Idea Pins or short-form videos.

Final Thoughts

Audience Insights is more than a reporting tool. It’s a compass. Used well, it helps you go beyond vanity metrics and build a content and advertising strategy rooted in real user behavior.

Even if you’re not running Pinterest Ads yet, this data can sharpen your organic strategy and prep you for future success when you are ready to invest.

Who’s Engaging With Your Pins? A Guide to Pinterest Audience Insights Read More »

linkedin impressions

What Happened When I Cut My LinkedIn Post Frequency in Half

Reading Time: 2 minutes

Earlier this year, I published a post about what I learned from posting every business day on LinkedIn for a full month. Since then, I’ve kept experimenting and paying close attention to what’s working and what’s sustainable.

From January 1 to May 14, I posted on LinkedIn every business day minus holidays. But starting May 14, I made a strategic shift to publish only twice a week—on Tuesdays and Thursdays.

I wasn’t burned out or running out of ideas. But I received some thoughtful feedback from a former colleague to scale back so I could focus more on my MBA and job search. I took that advice seriously despite cutting back on something I loved.

So, did posting less often hurt my reach or engagement?

Impressions: Consistent Results, Slightly Fewer Spikes

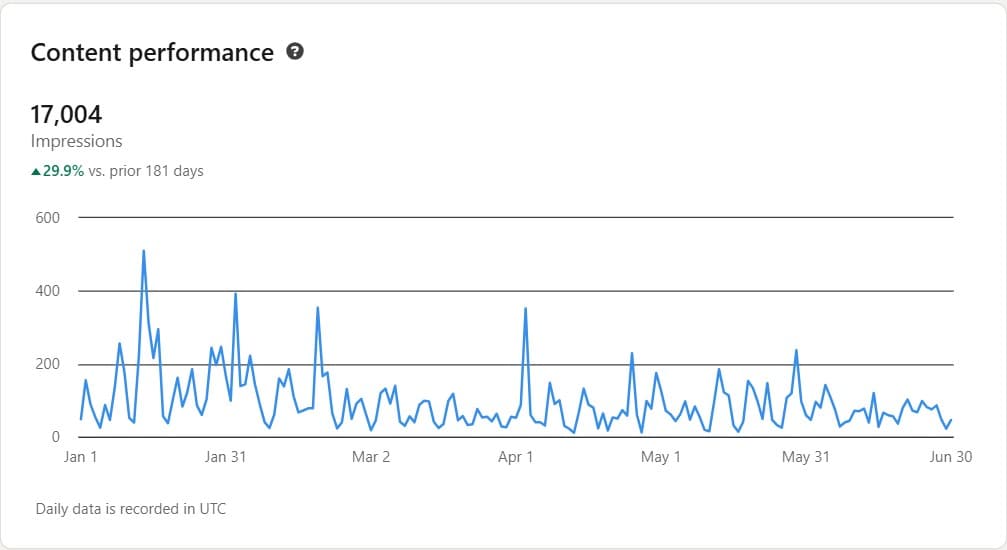
From January through June, I earned over 17,000 impressions on my LinkedIn posts, up nearly 30% compared to the previous 181-day period. Even after scaling back, my overall reach didn’t drop significantly. The volume stayed consistent. What did change is the number of dramatic spikes. Earlier in the year, I saw several big jumps in visibility. Since May 14, the trend has been flatter, which could be due to reduced post volume, or simply the nature of the topics I’ve been covering lately.

But the key takeaway? Less frequent posting hasn’t hurt performance in any meaningful way.

Engagement: Holding Steady, Even Improving

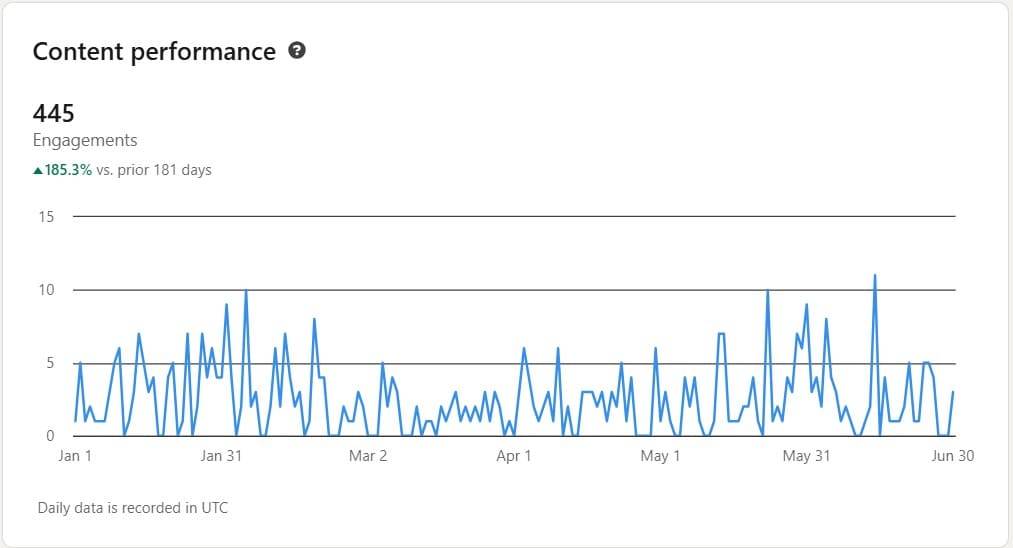
Even more interesting is the engagement. My posts generated 445 engagements—a jump of 185% from the previous period. That’s comments, reactions, and shares, which reflect how the audience is actually interacting with my content.

Since May 14, I’ve seen strong bursts of engagement, even with just two posts per week. In some cases, the engagement looks higher than what I saw while posting daily. This suggests a few things:

  • Quality over quantity is working. Posting less hasn’t dulled my impact. It may have sharpened it.
  • Intentional content resonates more. With fewer posts, each one stands out more and gives people space to respond.
  • Consistency still matters. Even at twice a week, maintaining a regular rhythm helps keep my audience connected.

I didn’t disappear. I just got more focused. And the data shows that approach is paying off.

Final Thoughts

This small experiment has reminded me that posting daily isn’t the only way to grow. For me, twice a week feels sustainable and effective, and it gives me room to create better content while pursuing other goals.

I’ll keep tracking, updating these charts, and adjusting along the way. If you’re wondering whether to scale back your own content schedule, know this: staying visible doesn’t mean staying overwhelmed. Be consistent, stay intentional, and measure what matters.

Have you adjusted your posting cadence before? I’d love to hear what changed for you.

What Happened When I Cut My LinkedIn Post Frequency in Half Read More »

social media roi

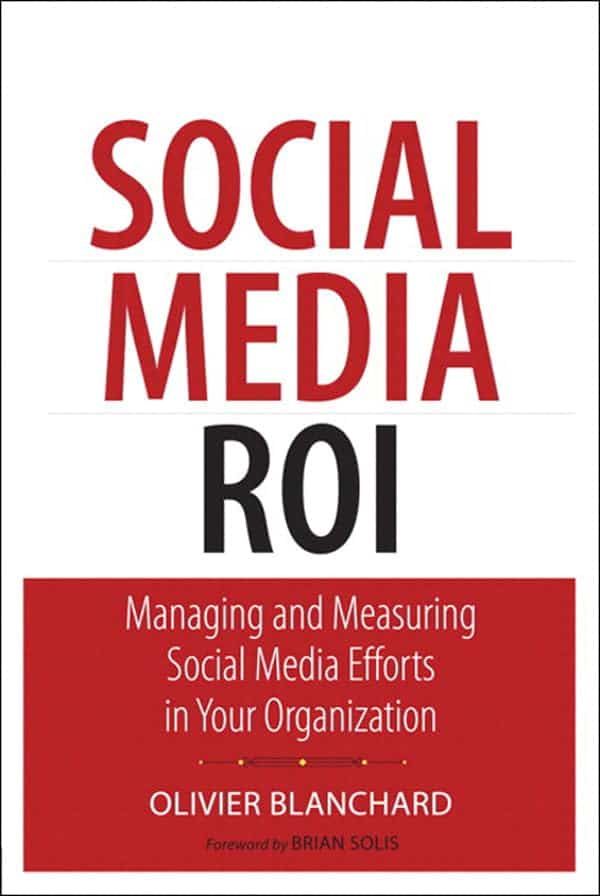
Social Media ROI by Olivier Blanchard Book Summary

Reading Time: 4 minutes

Top Three Quotes

  1. “The value of social media is not the platform, it is what you do with it.”
  2. “If you don’t understand how to measure ROI, you don’t understand business.”
  3. “Social media is not free. It takes time, it takes resources, and it takes money.”

Book Theme

Social Media ROI’s main theme is demystifying social media’s impact on business performance, focusing on how to measure, manage, and optimize social media activities to generate clear, quantifiable ROI.

Why You Should Read This Book

You manage marketing budgets and must demonstrate clear, measurable returns on investment to executives or stakeholders.

You need to prove the business value of social media initiatives and show how they contribute to revenue or cost savings.

You want to move beyond surface-level metrics such as likes, shares, and followers, and instead focus on meaningful business outcomes.

You are looking for a structured framework that helps integrate social media activities into your organization’s broader business objectives.

Key Ideas and Arguments Presented

Sustainability: Success requires long-term commitment and appropriate resource allocation over time.

Social Media Requires Business Alignment: Social media efforts must connect directly to overall business objectives.

ROI Must Be Defined Clearly: The return on investment in social media should be tied to measurable financial outcomes rather than vanity metrics.

Strategy Before Tactics: Many organizations jump into social platforms without a clear strategy, but the book emphasizes the need for thorough planning first.

The Importance of Governance: It is essential to establish policies, processes, and guidelines to manage risks and ensure consistency across teams.

Measurement Framework: Clear definitions of goals, key performance indicators, and success criteria are critical for tracking progress and impact.

Change Management: Adopting social media affects company culture and workflows, so managing this change intentionally is necessary.

Training and Enablement: Employees and teams require education on tools, processes, and expectations to be effective.

Customer Engagement: Listening to customers, responding effectively, and creating value for the audience are fundamental components of social media success.

Integration with Other Functions: Social media cannot operate in isolation and should be connected to sales, customer service, and product teams.

Book Outline

The following are the main sections and chapters as listed in the book:

  • I. Social Media Program Development
    • 1. Creating the Social Company
    • 2. Aligning Social Media to Business Goals
    • 3. Planning for Performance Measurement
    • 4. Establishing Clarity of Vision, Purpose, and Execution
  • II. Social Media Program Integration
    • 5. Understanding How Social Media Plugs into the Organization
    • 6. The People Principle
    • 7. Establishing Social Media Guidelines for the Organization
    • 8. Laying the Operational Groundwork for Effective Social Media Management
    • 9. The New Rules of Brand Communications in the Age of Social Media
  • III. Social Media Program Management
    • 10. Listening Before Talking
    • 11. Social Media and Digital Brand Management
    • 12. Real-Time Digital Support: Fixing Customer Service Once and for All
    • 13. Social Media Program Management: Putting It All Together
  • IV. Social Media Program Measurement
    • 14. Creating a Measurement Practice for Social Media Programs
    • 15. ROI and Other Social Media Outcomes
    • 16. F.R.Y. (Frequency, Reach, and Yield) and Social Media
    • 17. Social Media Program Analysis and Reporting

Key Takeaways

  1. Training and change management are critical elements that are often overlooked but essential for success.
  2. Social media ROI is achievable and measurable when objectives are clearly defined.
  3. Businesses must approach social media as an investment rather than treating it as a side project.
  4. Metrics should be linked to actual business outcomes instead of focusing only on engagement numbers.
  5. Establishing governance helps reduce risk and improve efficiency across teams.

Key Techniques

ROI Calculation Templates: Apply practical formulas and templates to quantify and demonstrate financial returns.

Measurement Frameworks: Define goals, key performance indicators, and conversion metrics early in the process.

Social Media Audit: Evaluate the current state of your social media presence and readiness for improvement.

Governance Model: Establish clear rules, escalation paths, and responsibilities to manage activity and risks.

Alignment Process: Connect social media objectives directly to overall business strategies and priorities.

Author’s Qualifications

Olivier Blanchard is a recognized expert in brand management and social business strategy. His background includes:

  • One of the earliest voices advocating for accountability in social media investments
  • Principal at BrandBuilder Marketing
  • Consultant for global brands across multiple industries
  • Frequent speaker on social media measurement and digital transformation

Comparison to Similar Books

Compared to Measure What Matters by Katie Delahaye Paine, Blanchard provides more comprehensive operational guidance for implementing ROI programs.

Compared to Groundswell by Charlene Li and Josh Bernoff, Social Media ROI is more focused on financial measurement rather than adoption strategies.

Unlike Trust Agents by Chris Brogan and Julien Smith, this book emphasizes processes and frameworks instead of storytelling.

Target Audience

  • Business Analysts responsible for marketing KPIs
  • Marketing Directors and Managers
  • Social Media Strategists
  • Digital Transformation Leads
  • CMOs and Executive Leadership
  • Small Business Owners who are serious about measurement
  • Consultants and Agency Professionals

Critical Response to the Book

Social Media ROI has been widely praised for:

  • Providing practical frameworks in an area often dominated by hype
  • Demystifying complex measurement concepts
  • Being accessible without oversimplification

Some critiques note:

Certain examples could be more current as platforms evolve

It assumes readers have some foundational marketing knowledge

One Sentence Takeaway

Social media only becomes valuable to business when you align it with strategy, measure its impact rigorously, and treat it as an investment that demands accountability.

Social Media ROI by Olivier Blanchard Book Summary Read More »

Unlocking the Power of Pinterest Analytics: Why You Should Convert to a Business Profile

Reading Time: 3 minutes

If you are using Pinterest to build your brand, drive traffic, or grow an audience, it is easy to overlook the wealth of data hiding behind the scenes. One of the simplest ways to level up your Pinterest strategy without spending a dime is to convert your profile to a business account.

This change does not cost anything and it unlocks a much richer set of analytics that can help you see what is working and where to improve.

What You Get When You Upgrade

A personal Pinterest account gives you only a basic snapshot of your activity. Switching to a business profile opens access to detailed performance metrics, including Impressions, Engagements, Pin Clicks, Outbound Clicks, Saves, Engagement Rate, Outbound Click Rate, Average Save Rate, Total Audience, and Engaged Audience.

From these, I have found some metrics to be especially valuable in assessing whether my content is resonating. These include Impressions, Engagements, Pin Clicks, Outbound Clicks, Saves, Engagement Rate, Pin Click Rate, Outbound Click Rate, and Engaged Audience.

Below, I am sharing two dashboards that show my Pinterest account’s performance in May and June. My plan is to update these monthly to track progress as I continue adding fresh pins, including both my own content and curated pins from others.

Tips for Measuring Pinterest Analytics

Here are some sound best practices to consider.

  1. Look beyond vanity metrics. Impressions are helpful, but saves and outbound clicks tell you who is actually taking action.
  2. Track trends over time. A single week does not tell the full story, so watch for sustained improvement or decline over several months.
  3. Segment your data. Compare performance between your original content and re-pins. Often, your own pins will be the biggest drivers of outbound clicks.
  4. Watch your save rate. Pins with high save rates often have evergreen value, so consider promoting them further or creating similar content.
  5. Export your data. Although Pinterest provides some helpful charts in the app, serious reporting is largely a manual exercise. You will need to export metrics or compile them in your own dashboards to get a clear picture.
  6. Leverage rich pins and keyword optimization. Enhanced pins with extra metadata often outperform standard pins in both impressions and engagement.

Why Most People Miss Out

Many users never realize this level of reporting exists because it requires a business profile. Pinterest does not exactly shout about it. If you are serious about measuring what works and refining your strategy, this is an upgrade you cannot afford to skip.

Curious about who’s engaging with your Pins?

Check out my guide to Pinterest Audience Insights and see what data you can unlock.

Glossary of Key Pinterest Metrics

Average Save Rate: Saves divided by impressions.

Engaged Audience: Unique viewers who took action on your pins.

Engagement Rate: Engagements divided by impressions.

Engagements: Total actions like saves, clicks, or close-ups.

Impressions: How often your pins appeared on screen.

Outbound Click Rate: Outbound clicks divided by impressions.

Outbound Clicks: Clicks that send people to your website or link destination.

Pin Clicks: Clicks that open your pin in detail.

Saves: Pins added to users’ boards.

Total Audience: Unique viewers who saw your pins.

Unlocking the Power of Pinterest Analytics: Why You Should Convert to a Business Profile Read More »

Bar chart showing key social media metrics by platform in 2024, including engagement, reach, growth rate, CTR, CVR, and CPC for TikTok, Instagram, Facebook, LinkedIn, and Twitter.

Top Social Media KPIs That Actually Matter

Reading Time: 6 minutes

How do you know if 100 likes on a post is a lot or a little? The answer lies in context. Key performance indicators (KPIs) are the metrics that matter for social media success, and industry benchmarks give you that all-important context for evaluating your performance.

In today’s rapidly evolving social media landscape, understanding these benchmarks helps marketers set realistic goals and gauge where they stand against the competition. Below is a summary of the top social media KPIs and their average benchmarks using data from 2024, followed by a deeper dive into each metric.

KPI2024 Benchmarks
Engagement RateFacebook ~1.2%, Instagram ~3.5%[1]
X (Twitter) ~0.14%[2], TikTok ~5.7%[3]
Reach Rate (Organic)Instagram ~4.0%, Facebook ~2.6%[4]
Audience Growth Rate (Monthly)Instagram ~1.7%, Facebook ~0.7%, X ~0.3%[5]
Click-Through Rate (CTR)Facebook ads ~1.6% CTR (avg)[6]
Cost Per Click (CPC)Facebook ~\$0.77, LinkedIn ~\$5.00
TikTok/Instagram ~\$0.50–\$0.60[9]
Conversion RateFacebook lead-gen ads ~9%[7]
Generally, >3% is considered good[8]

To help you benchmark your performance more easily, here’s a side-by-side chart of the most important social media metrics by platform—including engagement, reach, growth rates, click-through rates, conversion rates, and ad costs.

Engagement Rate

What it is: Engagement rate measures how actively your audience interacts with your content. It’s usually expressed as the percentage of people who engaged (likes, comments, shares, etc.) out of those who saw the content. Some marketers calculate it as engagements divided by total followers, while others use engagements divided by reach (unique viewers) for a more precise rate.

Why it matters: Engagement rate is a key indicator of content resonance. High engagement means your content is striking a chord with your audience, which in turn can boost visibility via platform algorithms. It’s a comparative metric too—a 2% engagement rate might be average on one platform but excellent on another.

Benchmarks: Engagement levels vary by platform. For example, Instagram’s average engagement rate is around 3.5%, significantly higher than Facebook’s ~1.2%[1]. TikTok leads in this area with roughly a 5%+ engagement rate[3], reflecting its highly interactive user base. By contrast, X (Twitter) sees only about 0.1% engagement on average[2], indicating that interaction is much harder to come by. Keep in mind that overall social media engagement has been on a downward trend for some networks, so creating compelling content is more important than ever to maintain strong engagement.

Reach and Impressions

What it is: Reach is the number of unique users who see your post, whereas impressions count total views (including multiple views by the same user). Essentially, reach answers “how many people saw it?” and impressions answer “how many times was it seen?”

Why it matters: These metrics tell you the size of the audience your content is actually hitting. With algorithms limiting organic exposure, not all your followers will see every post. Tracking reach (often presented as a percentage of your follower count, known as reach rate) helps you understand how content distribution is performing. Impressions can indicate how viral or frequently shared a piece of content became beyond the initial audience.

Benchmarks: Organic reach is notably low across major platforms. On Facebook, an average post might reach only about 2.6% of your page’s followers, and on Instagram around 4.0%[4]. In other words, out of 1,000 followers, only a few dozen may see a given post. This underscores the importance of optimizing content timing and quality to extend reach. Impressions tend to be 1–2x higher than reach on content that gets reshared or viewed multiple times, but reaching even a fraction of your follower base is an achievement under current algorithms. Many brands also utilize paid promotion to combat declining organic reach.

Audience Growth Rate

What it is: Audience growth rate measures how quickly you’re gaining (or losing) followers over time. It’s often expressed as a monthly percentage growth. For example, if you had 10,000 followers and gained 300 in a month, that’s a 3% monthly growth rate.

Why it matters: This KPI reflects your brand’s expanding reach and popularity on social media. A healthy growth rate means your content and social presence are attracting new people consistently. If growth is stagnant or negative, it may signal the need to adjust your strategy or content mix to appeal to new audiences.

Benchmarks: Growth rates on established platforms are generally modest. Across industries, Instagram pages grow by around 1.5–2% per month on average, whereas Facebook pages see closer to ~0.5–0.7% monthly growth[5]. Twitter (X) tends to be slower still, often around 0.3% per month[5]. These are average figures; a strong campaign or viral content can spike your growth well above the baseline (for example, a trending TikTok account might explode with followers in a short time). Comparing your growth rate against these benchmarks helps set realistic expectations. For instance, doubling your followers in a year on a mature platform would be an achievement since it implies ~8% monthly growth sustained over 12 months.

Click-Through Rate (CTR)

What it is: CTR is the percentage of people who click on a link or call-to-action in your social media post or ad. It’s calculated as (clicks ÷ impressions) × 100%. For organic posts, this might apply to links in your content (e.g. “Learn more” or a blog post link). In social advertising, CTR is a critical metric for ad effectiveness.

Why it matters: CTR shows how compelling your content and offers are at driving action. A higher CTR means more of your audience was enticed to “swipe up,” “click the link,” or otherwise engage with your call-to-action. This often translates directly into traffic for your website or landing page. Monitoring CTR helps you gauge the effectiveness of your messaging, creative, and targeting. If impressions are high but CTR is low, your content might not be resonating or the call-to-action isn’t convincing.

Benchmarks: Click-through rates on social content are typically in the low single digits. For example, Facebook ads average around a 1.6% CTR across industries[6]. That means out of 100 impressions, only one or two people click through on average. On organic posts, CTR can vary widely depending on content type (a meme vs. a link post) and platform (links on Twitter often see well under 1% click rates, for instance). Anything above a few percent is usually considered a strong CTR in the social media context. Improving CTR can involve tweaking your copy, visuals, or audience targeting to better entice viewers to take that next step.

Conversion Rate

What it is: Conversion rate is the percentage of users who take a desired action after clicking through your social content. That action could be making a purchase, signing up for a newsletter, filling out a lead form, or any defined goal. In the context of social media marketing, conversion rate often tracks how many of the people who come to your website from social actually convert into leads or customers.

Why it matters: This is the bottom-line metric that connects social media efforts to business outcomes. You might have a million impressions and thousands of clicks, but if none of those clicks convert into meaningful results, the campaign hasn’t delivered real value. Monitoring conversion rate helps you assess the quality of traffic and the effectiveness of your landing pages or social commerce funnels. It also informs ROI calculations for social media marketing.

Benchmarks: Conversion rates vary drastically by platform and industry, but we can look at a few benchmarks. Facebook’s dedicated lead-generation ads, for example, have an average conversion rate around 9%[7] (meaning about 1 in 11 clickers complete the lead form). In contrast, driving eCommerce sales from cold social media traffic will usually see lower conversion percentages. As a general rule of thumb in social media marketing, anything above about 3% is often considered a good conversion rate[8]. Keep in mind that “good” is relative as some industries or campaign types naturally convert at higher rates than others. The key is to track your own conversion metrics over time and strive to beat both your past performance and relevant industry benchmarks.

In summary, knowing these KPIs and their benchmarks equips you to critically evaluate your social media performance. Use these numbers as reference points: if your metrics are lagging far behind industry averages, it’s a signal to refine your strategy, and if you’re exceeding benchmarks, it’s a sign you’re doing something right. But remember—your best benchmark is often your own progress. Improvement over time shows that your strategy is working, even if you’re still catching up to broader averages. By continuously monitoring and comparing your KPIs against both industry standards and your own historical data, you can make informed, data-driven decisions to improve your social media marketing outcomes in 2024 and beyond.

  1. Socialinsider – Social Media Reach: Statistics For 2024.
  2. Brandwatch – Cross-Industry Social Media Benchmarks (2024).
  3. Rival IQ – 2023 Social Media Industry Benchmark Report.
  4. Socialinsider – Social Media Reach: Statistics For 2024.
  5. Brandwatch – Cross-Industry Social Media Benchmarks (2024).
  6. WordStream – Facebook Ads Benchmarks 2024.
  7. WordStream – Facebook Ads Benchmarks 2024.
  8. Shopify – How to Improve Your Social Media Conversion Rate (2025).
  9. WordStream – Facebook Ads Benchmarks 2024.

Top Social Media KPIs That Actually Matter Read More »

a historical evolution of social media marketing platforms content and influencers

A Historical Evolution of Social Media Marketing: Platforms, Content, and Influencers

Reading Time: 2 minutes

Social media has transformed how people connect, share, and stay informed. From the early days of Six Degrees and Friendster to today’s dominant platforms like Instagram, TikTok, and LinkedIn, each shift has reshaped our digital lives. This timeline highlights the biggest platform launches, viral growth milestones, major acquisitions, and shutdowns that tell the story of social media’s rapid evolution. It is a resource for creators, marketers, and curious minds to reflect on where we have been and where the future may lead.

2025

March – TikTok announces photo-sharing app “TikTok Notes,” aiming to rival Instagram.

January – Meta launches ad-free subscription tiers for Facebook and Instagram in the EU.

2024

October – Twitter is officially rebranded to X under Elon Musk.

April – Bluesky opens to the public as a decentralized social alternative.

March – LinkedIn surpasses 1 billion members globally.

February – BeReal begins sharp user decline, highlighting challenges for trend-driven apps.

2023

July – Threads launches as Meta’s Twitter competitor and gains 100M users in under a week.

2022

October – Elon Musk acquires Twitter, triggering major platform and policy changes.

2020

June – TikTok surpasses 2 billion global downloads.

2019

April 2 – Google+ is officially shut down due to low usage and security concerns.

2018

August – TikTok merges with Musical.ly, rapidly gaining popularity worldwide.

2016

January – Instagram hits 400 million monthly active users.

2013

January – Vine peaks in popularity with short looping videos and viral content.

2012

April 9 – Facebook acquires Instagram for $1 billion.

2011

June 28 – Google+ officially launches as a Facebook alternative.

2010

October 6 – Instagram is launched and gains 1M users in two months.

2009

March – Foursquare launches, bringing gamified check-ins to social media.

2008

May – Facebook overtakes MySpace in monthly U.S. visitors.

2006

March 21 – Twitter launches with its first tweet: “just setting up my twttr.”

2005

February 14 – YouTube is launched, revolutionizing video sharing online.

2004

February 4 – Facebook is launched at Harvard University as “TheFacebook.”

2003

August 1 – MySpace launches, quickly becoming the most visited social site until 2008.

2002

December – Friendster launches, pioneering the modern social networking model.

1997

October – Six Degrees launches, allowing users to list friends and family — often called the first true social network.

A Historical Evolution of Social Media Marketing: Platforms, Content, and Influencers Read More »