If you are using Pinterest to build your brand, drive traffic, or grow an audience, it is easy to overlook the wealth of data hiding behind the scenes. One of the simplest ways to level up your Pinterest strategy without spending a dime is to convert your profile to a business account.
This change does not cost anything and it unlocks a much richer set of analytics that can help you see what is working and where to improve.
What You Get When You Upgrade
A personal Pinterest account gives you only a basic snapshot of your activity. Switching to a business profile opens access to detailed performance metrics, including Impressions, Engagements, Pin Clicks, Outbound Clicks, Saves, Engagement Rate, Outbound Click Rate, Average Save Rate, Total Audience, and Engaged Audience.
From these, I have found some metrics to be especially valuable in assessing whether my content is resonating. These include Impressions, Engagements, Pin Clicks, Outbound Clicks, Saves, Engagement Rate, Pin Click Rate, Outbound Click Rate, and Engaged Audience.
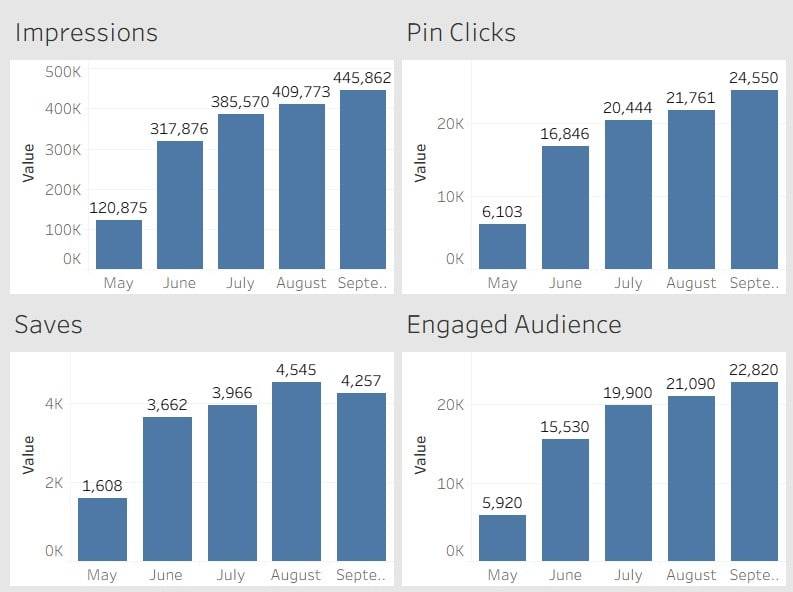
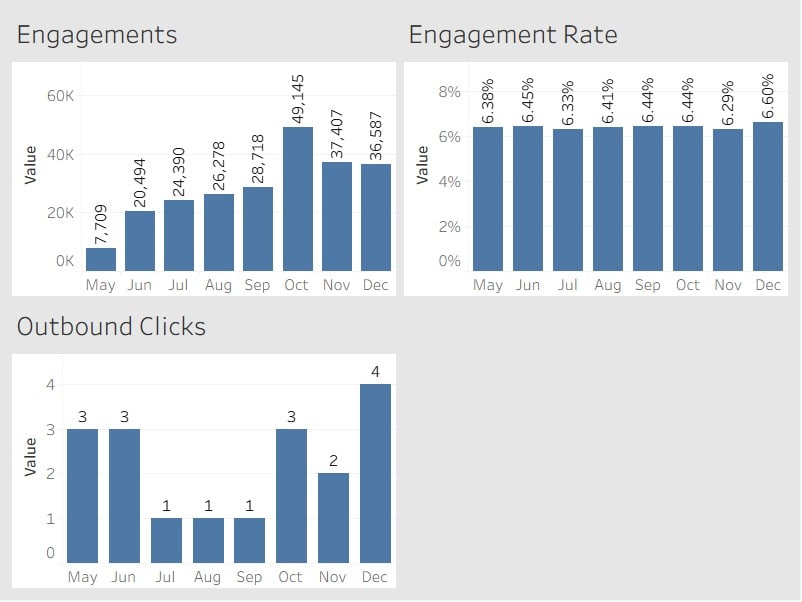
Below, I am sharing two dashboards that show my Pinterest account’s performance in May and June. My plan is to update these monthly to track progress as I continue adding fresh pins, including both my own content and curated pins from others.
Tips for Measuring Pinterest Analytics
Here are some sound best practices to consider.
Look beyond vanity metrics. Impressions are helpful, but saves and outbound clicks tell you who is actually taking action.
Track trends over time. A single week does not tell the full story, so watch for sustained improvement or decline over several months.
Segment your data. Compare performance between your original content and re-pins. Often, your own pins will be the biggest drivers of outbound clicks.
Watch your save rate. Pins with high save rates often have evergreen value, so consider promoting them further or creating similar content.
Export your data. Although Pinterest provides some helpful charts in the app, serious reporting is largely a manual exercise. You will need to export metrics or compile them in your own dashboards to get a clear picture.
Leverage rich pins and keyword optimization. Enhanced pins with extra metadata often outperform standard pins in both impressions and engagement.
Why Most People Miss Out
Many users never realize this level of reporting exists because it requires a business profile. Pinterest does not exactly shout about it. If you are serious about measuring what works and refining your strategy, this is an upgrade you cannot afford to skip.
How do you know if 100 likes on a post is a lot or a little? The answer lies in context. Key performance indicators (KPIs) are the metrics that matter for social media success, and industry benchmarks give you that all-important context for evaluating your performance.
In today’s rapidly evolving social media landscape, understanding these benchmarks helps marketers set realistic goals and gauge where they stand against the competition. Below is a summary of the top social media KPIs and their average benchmarks using data from 2024, followed by a deeper dive into each metric.
KPI
2024 Benchmarks
Engagement Rate
Facebook ~1.2%, Instagram ~3.5%[1] X (Twitter) ~0.14%[2], TikTok ~5.7%[3]
Facebook lead-gen ads ~9%[7] Generally, >3% is considered good[8]
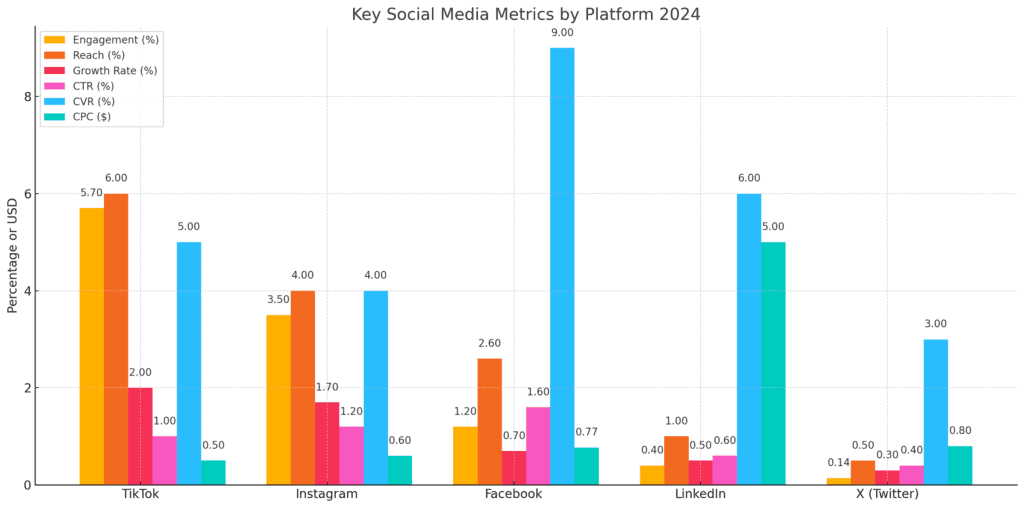
To help you benchmark your performance more easily, here’s a side-by-side chart of the most important social media metrics by platform—including engagement, reach, growth rates, click-through rates, conversion rates, and ad costs.
Engagement Rate
What it is:Engagement rate measures how actively your audience interacts with your content. It’s usually expressed as the percentage of people who engaged (likes, comments, shares, etc.) out of those who saw the content. Some marketers calculate it as engagements divided by total followers, while others use engagements divided by reach (unique viewers) for a more precise rate.
Why it matters: Engagement rate is a key indicator of content resonance. High engagement means your content is striking a chord with your audience, which in turn can boost visibility via platform algorithms. It’s a comparative metric too—a 2% engagement rate might be average on one platform but excellent on another.
Benchmarks: Engagement levels vary by platform. For example, Instagram’s average engagement rate is around 3.5%, significantly higher than Facebook’s ~1.2%[1]. TikTok leads in this area with roughly a 5%+ engagement rate[3], reflecting its highly interactive user base. By contrast, X (Twitter) sees only about 0.1% engagement on average[2], indicating that interaction is much harder to come by. Keep in mind that overall social media engagement has been on a downward trend for some networks, so creating compelling content is more important than ever to maintain strong engagement.
Reach and Impressions
What it is:Reach is the number of unique users who see your post, whereas impressions count total views (including multiple views by the same user). Essentially, reach answers “how many people saw it?” and impressions answer “how many times was it seen?”
Why it matters: These metrics tell you the size of the audience your content is actually hitting. With algorithms limiting organic exposure, not all your followers will see every post. Tracking reach (often presented as a percentage of your follower count, known as reach rate) helps you understand how content distribution is performing. Impressions can indicate how viral or frequently shared a piece of content became beyond the initial audience.
Benchmarks: Organic reach is notably low across major platforms. On Facebook, an average post might reach only about 2.6% of your page’s followers, and on Instagram around 4.0%[4]. In other words, out of 1,000 followers, only a few dozen may see a given post. This underscores the importance of optimizing content timing and quality to extend reach. Impressions tend to be 1–2x higher than reach on content that gets reshared or viewed multiple times, but reaching even a fraction of your follower base is an achievement under current algorithms. Many brands also utilize paid promotion to combat declining organic reach.
Audience Growth Rate
What it is: Audience growth rate measures how quickly you’re gaining (or losing) followers over time. It’s often expressed as a monthly percentage growth. For example, if you had 10,000 followers and gained 300 in a month, that’s a 3% monthly growth rate.
Why it matters: This KPI reflects your brand’s expanding reach and popularity on social media. A healthy growth rate means your content and social presence are attracting new people consistently. If growth is stagnant or negative, it may signal the need to adjust your strategy or content mix to appeal to new audiences.
Benchmarks: Growth rates on established platforms are generally modest. Across industries, Instagram pages grow by around 1.5–2% per month on average, whereas Facebook pages see closer to ~0.5–0.7% monthly growth[5]. Twitter (X) tends to be slower still, often around 0.3% per month[5]. These are average figures; a strong campaign or viral content can spike your growth well above the baseline (for example, a trending TikTok account might explode with followers in a short time). Comparing your growth rate against these benchmarks helps set realistic expectations. For instance, doubling your followers in a year on a mature platform would be an achievement since it implies ~8% monthly growth sustained over 12 months.
Click-Through Rate (CTR)
What it is: CTR is the percentage of people who click on a link or call-to-action in your social media post or ad. It’s calculated as (clicks ÷ impressions) × 100%. For organic posts, this might apply to links in your content (e.g. “Learn more” or a blog post link). In social advertising, CTR is a critical metric for ad effectiveness.
Why it matters: CTR shows how compelling your content and offers are at driving action. A higher CTR means more of your audience was enticed to “swipe up,” “click the link,” or otherwise engage with your call-to-action. This often translates directly into traffic for your website or landing page. Monitoring CTR helps you gauge the effectiveness of your messaging, creative, and targeting. If impressions are high but CTR is low, your content might not be resonating or the call-to-action isn’t convincing.
Benchmarks: Click-through rates on social content are typically in the low single digits. For example, Facebook ads average around a 1.6% CTR across industries[6]. That means out of 100 impressions, only one or two people click through on average. On organic posts, CTR can vary widely depending on content type (a meme vs. a link post) and platform (links on Twitter often see well under 1% click rates, for instance). Anything above a few percent is usually considered a strong CTR in the social media context. Improving CTR can involve tweaking your copy, visuals, or audience targeting to better entice viewers to take that next step.
Conversion Rate
What it is: Conversion rate is the percentage of users who take a desired action after clicking through your social content. That action could be making a purchase, signing up for a newsletter, filling out a lead form, or any defined goal. In the context of social media marketing, conversion rate often tracks how many of the people who come to your website from social actually convert into leads or customers.
Why it matters: This is the bottom-line metric that connects social media efforts to business outcomes. You might have a million impressions and thousands of clicks, but if none of those clicks convert into meaningful results, the campaign hasn’t delivered real value. Monitoring conversion rate helps you assess the quality of traffic and the effectiveness of your landing pages or social commerce funnels. It also informs ROI calculations for social media marketing.
Benchmarks: Conversion rates vary drastically by platform and industry, but we can look at a few benchmarks. Facebook’s dedicated lead-generation ads, for example, have an average conversion rate around 9%[7] (meaning about 1 in 11 clickers complete the lead form). In contrast, driving eCommerce sales from cold social media traffic will usually see lower conversion percentages. As a general rule of thumb in social media marketing, anything above about 3% is often considered a good conversion rate[8]. Keep in mind that “good” is relative as some industries or campaign types naturally convert at higher rates than others. The key is to track your own conversion metrics over time and strive to beat both your past performance and relevant industry benchmarks.
In summary, knowing these KPIs and their benchmarks equips you to critically evaluate your social media performance. Use these numbers as reference points: if your metrics are lagging far behind industry averages, it’s a signal to refine your strategy, and if you’re exceeding benchmarks, it’s a sign you’re doing something right. But remember—your best benchmark is often your own progress. Improvement over time shows that your strategy is working, even if you’re still catching up to broader averages. By continuously monitoring and comparing your KPIs against both industry standards and your own historical data, you can make informed, data-driven decisions to improve your social media marketing outcomes in 2024 and beyond.
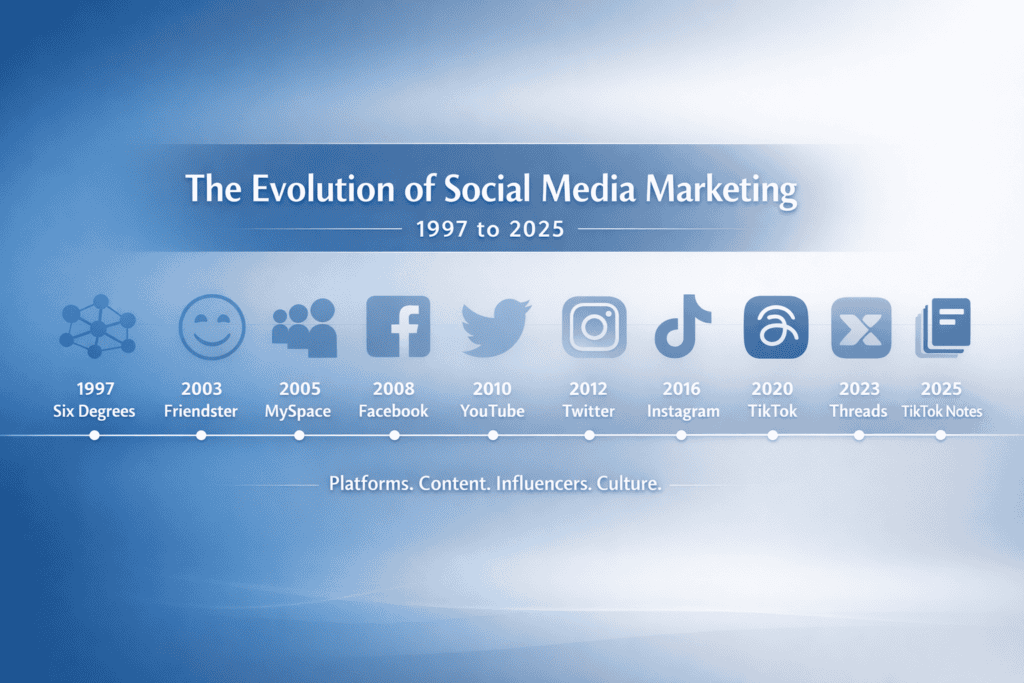
Social media has transformed how people connect, share, and stay informed. From the early days of Six Degrees and Friendster to today’s dominant platforms like Instagram, TikTok, and LinkedIn, each shift has reshaped our digital lives. This timeline highlights the biggest platform launches, viral growth milestones, major acquisitions, and shutdowns that tell the story of social media’s rapid evolution. It is a resource for creators, marketers, and curious minds to reflect on where we have been and where the future may lead.
2025
March – TikTok announces photo-sharing app “TikTok Notes,” aiming to rival Instagram.
January – Meta launches ad-free subscription tiers for Facebook and Instagram in the EU.
2024
October – Twitter is officially rebranded to X under Elon Musk.
April – Bluesky opens to the public as a decentralized social alternative.
March – LinkedIn surpasses 1 billion members globally.
February – BeReal begins sharp user decline, highlighting challenges for trend-driven apps.
2023
July – Threads launches as Meta’s Twitter competitor and gains 100M users in under a week.
2022
October – Elon Musk acquires Twitter, triggering major platform and policy changes.
2020
June – TikTok surpasses 2 billion global downloads.
2019
April 2 – Google+ is officially shut down due to low usage and security concerns.
2018
August – TikTok merges with Musical.ly, rapidly gaining popularity worldwide.
2016
January – Instagram hits 400 million monthly active users.
2013
January – Vine peaks in popularity with short looping videos and viral content.
2012
April 9 – Facebook acquires Instagram for $1 billion.
2011
June 28 – Google+ officially launches as a Facebook alternative.
2010
October 6 – Instagram is launched and gains 1M users in two months.
2009
March – Foursquare launches, bringing gamified check-ins to social media.
2008
May – Facebook overtakes MySpace in monthly U.S. visitors.
2006
March 21 – Twitter launches with its first tweet: “just setting up my twttr.”
2005
February 14 – YouTube is launched, revolutionizing video sharing online.
2004
February 4 – Facebook is launched at Harvard University as “TheFacebook.”
2003
August 1 – MySpace launches, quickly becoming the most visited social site until 2008.
2002
December – Friendster launches, pioneering the modern social networking model.
1997
October – Six Degrees launches, allowing users to list friends and family — often called the first true social network.
I’ll admit it. I was late to the Instagram party. I didn’t even start my @MarketingWithDave account until March 2025. Since then, I’ve posted every Tuesday and Thursday, sticking to a consistent rhythm. I focused only on regular posts until the end of May, when my wife (a legit micro-influencer who actually knows what she’s doing) said, “You need to be doing Reels.”
She was right.
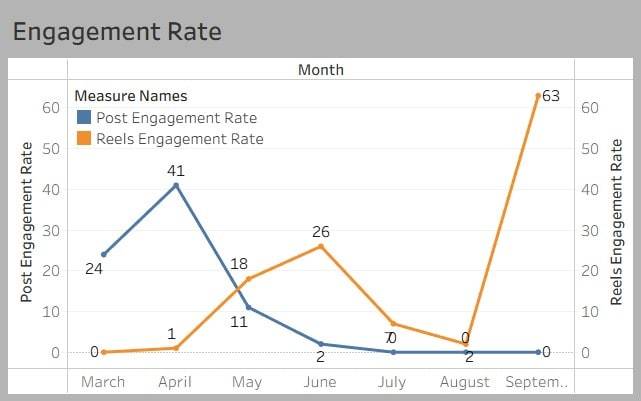
Even with just a sliver of data, it’s clear: Reels are outperforming regular posts, and quickly.
In March and April, I didn’t post a single Reel. But in May, after switching gears, my Reels engagement rate increased by over 1700%.
I manually tracked engagement metrics across starting in March. Yes, manually, because Instagram doesn’t make this easy. From what I can tell, very few people are reporting on Instagram analytics like this, because there’s no clean dashboard unless you’re exporting data via Meta’s API.
Here’s what I found:
Post engagement peaked in April, then dropped off hard in May.
Reels engagement shot up once I started posting them, despite only having a few Reel interactions to measure.
Reels + Stories = More Momentum
Starting at the end of May, every time I posted a Reel, I followed it up with an Instagram Story. I didn’t think much of it at the time, but looking back, this combo amplified results. Stories help remind followers your content exists and give Instagram another signal that you’re active and worth showing. It’s hard to separate their individual impact, but together, Reels and Stories feel like a smart move worth continuing.
A Few Takeaways
Reels clearly outshine Posts. Even just dipping my toe in brought more reach and interaction. The Instagram algorithm clearly favors them.
Manual tracking is a pain. Instagram’s insights are fragmented and there’s no easy export option. Unless you’re a spreadsheet nerd (guilty), most people won’t do this. But it’s worth doing if you’re trying to measure what’s actually working.
Post engagement isn’t dead, but it needs support. My posts still brought in likes and comments, but not at the same scale or consistency as Reels.
What’s Next?
I’m going to keep the Tuesday and Thursday cadence but mix in more Reels. I’ll keep tracking manually for now and continue updating these charts each month as better trending data becomes available.
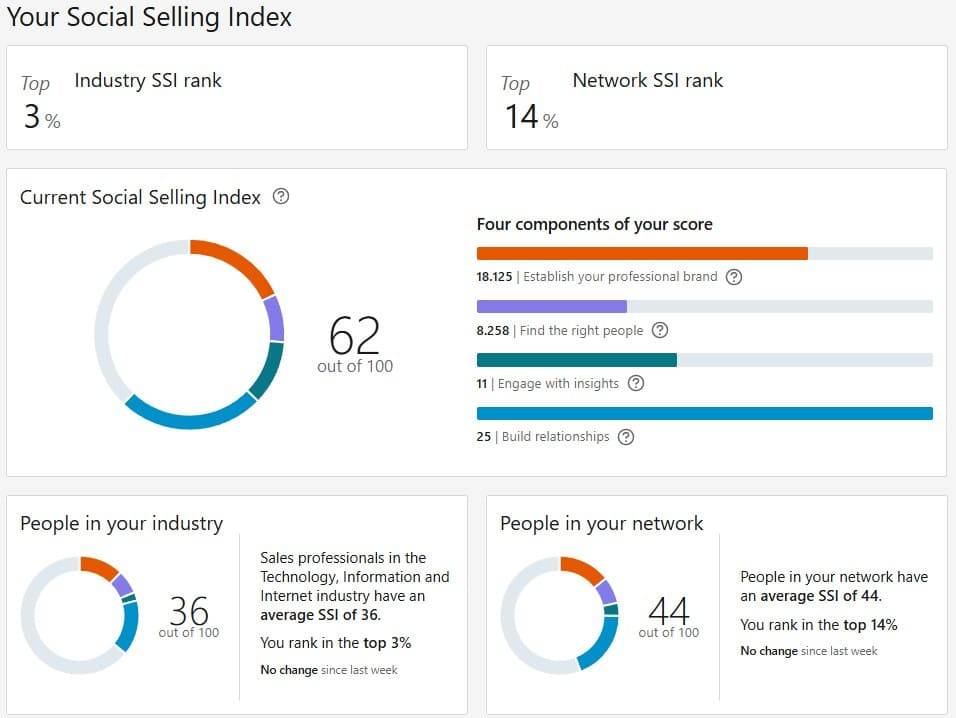
Did you know LinkedIn provides a free Social Selling Index (SSI) to help you measure your effectiveness on the platform? Updated daily, your SSI score evaluates how well you’re leveraging LinkedIn across four key areas:
Establishing your professional brand – Are you optimizing your profile and sharing valuable content?
Finding the right people – Are you strategically connecting with relevant professionals?
Engaging with insights – Are you interacting with content in meaningful ways?
Building relationships – Are you nurturing connections and growing your network?
Your SSI score ranges from 0 to 100, and a score of 70 or higher is considered strong. In fact, LinkedIn reports that top social sellers tend to score above 75, significantly outperforming those with lower scores in terms of sales success and engagement.
Additionally, your SSI dashboard allows you to compare your score to others in your industry and network, providing useful benchmarks. Here’s a look at my own SSI score:
If your score isn’t where you’d like it to be, here are some actionable ways to boost it:
Optimize Your Profile – Ensure your headline, summary, and experience sections highlight your expertise. Use a professional photo and a compelling background banner.
Share Valuable Content – Post industry insights, personal takeaways, and helpful resources regularly.
Engage with Others’ Content – Comment thoughtfully, react, and share posts to stay active in discussions.
Connect Strategically – Send personalized connection requests and build a meaningful network rather than just growing numbers.
Use LinkedIn’s Search Tools – Leverage advanced search to find and connect with the right professionals.
A strong SSI isn’t just about a number—it’s a reflection of how well you use LinkedIn to build authority, engage meaningfully, and strengthen professional relationships.
What’s your current SSI score? Share your insights in the comments!
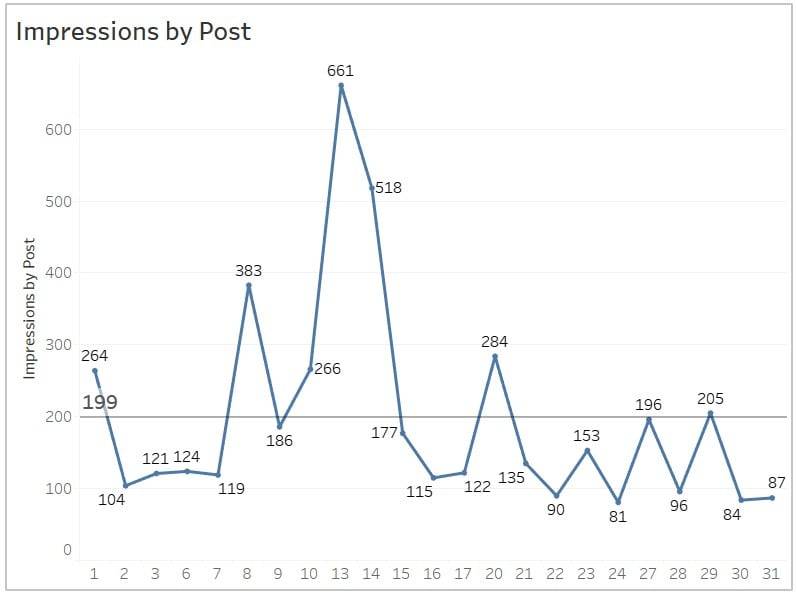
I set a simple goal to post on LinkedIn every business day in January—no expectations, just trying to share valuable digital marketing insights with every post. Now that January’s wrapped up, here’s how it went:
Key Metrics:
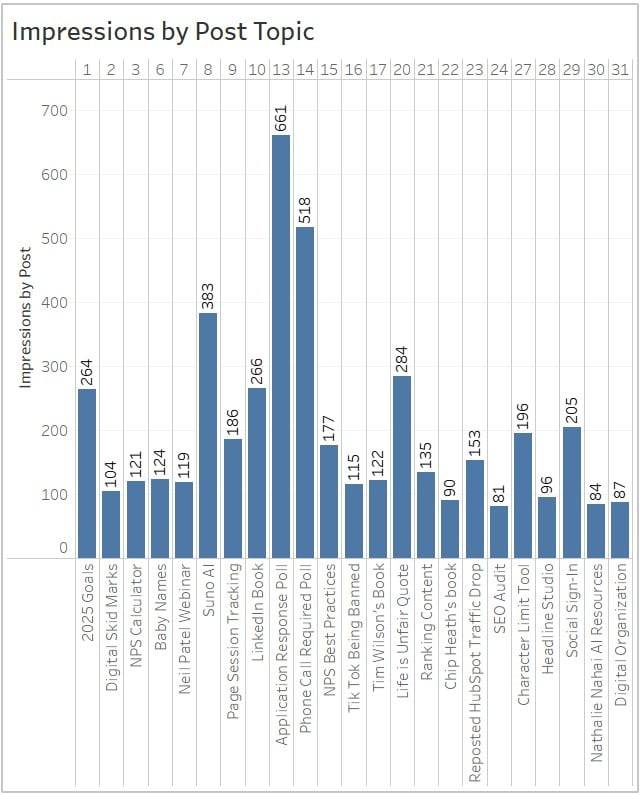
4,716 impressions
121 average impressions per post
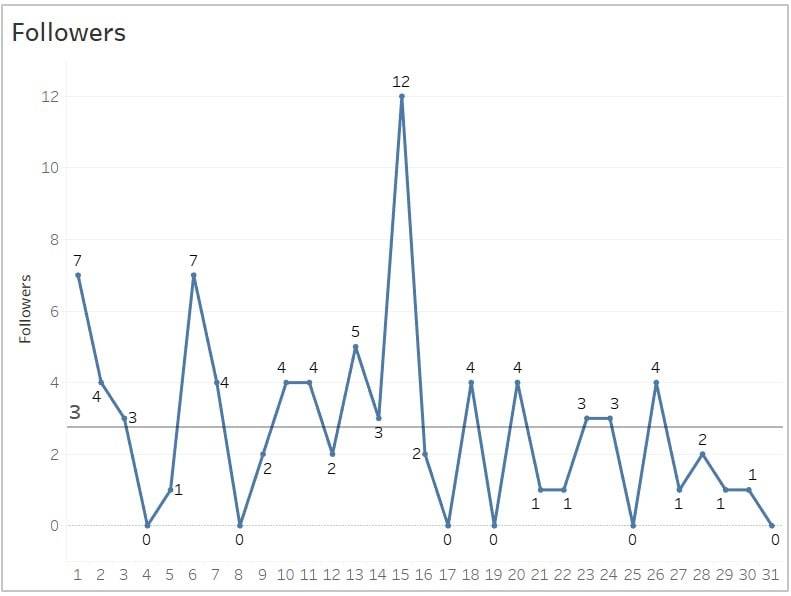
85 new followers
73 reactions
25 comments
14 reposts
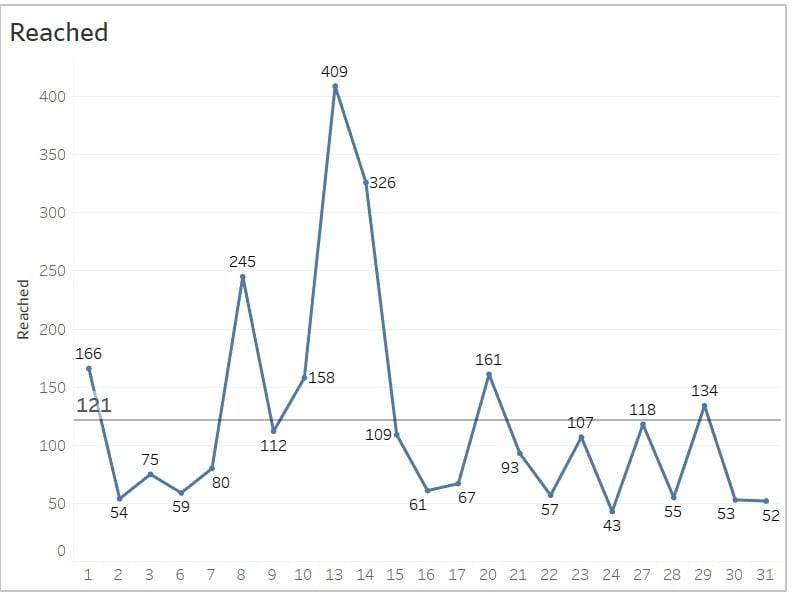
Reach per post ranged from 52 to 409
Insight #1: Topics and Hashtags Matter Most
While I didn’t expect hockey stick growth for any metric, I did expect impressions to gradually increase over time, but the data told a different story. Impressions fluctuated based on the popularity of individual posts rather than building momentum. The hashtags used and post relevance seemed to be the real game-changers.
Insight #2: Don’t Forget the Weekends
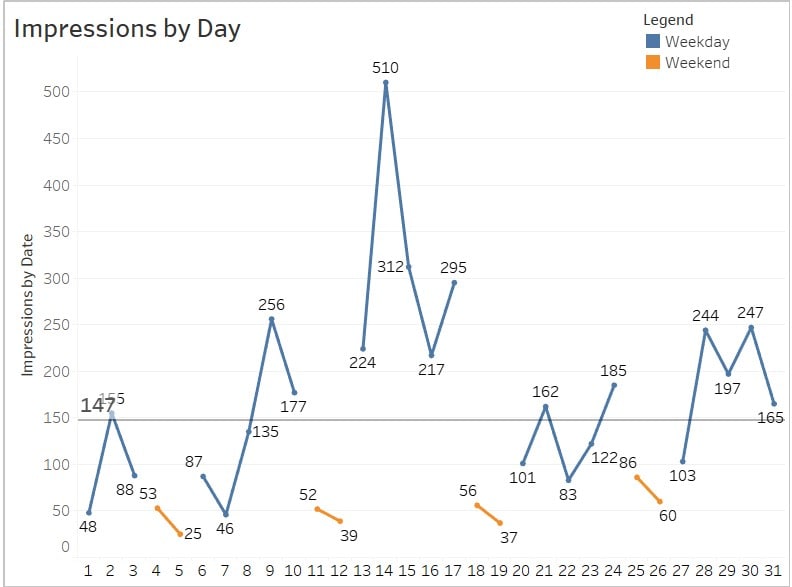
I expected low weekend traffic since I only posted Monday through Friday, but impressions remained consistent and even beating out some of my weaker posts. This shows LinkedIn content has a longer shelf life, and many professionals are active even on weekends, catching up or browsing casually. Posting on the weekend may be a worthwhile future test.
Follower gains fluctuated daily, with noticeable spikes aligning with highly engaging content. The largest surge occurred on the 15th, suggesting that standout posts can significantly boost growth. Maintaining a regular posting schedule would likely help sustain a steady follower increases over time.
Insight #5: Engaging Content Expands Reach
Reach showed similar fluctuations to follower growth, with peaks corresponding to days when content resonated strongly with the audience. This pattern highlights that while consistency is key, creating posts that spark interest and interaction can significantly amplify visibility beyond your immediate network.