Social

Collection of three tech review images featuring Van Halen case study, LEGO turnaround case study, and Apple vs Microsoft comparison, suitable for SEO on marketing blog.

Pin Generator Review: AI Pinterest Pin Creation and Scheduling

Reading Time: 7 minutes

Creating Pinterest pins at scale sounds amazing in theory. In reality, most Pinterest workflows still involve too much manual design work, too much tedious scheduling, and too much time spent trying to turn one blog post, product, or idea into enough fresh pins to matter.

That is why Pin Generator caught my attention.

I reviewed this tool nearly a dozen times before finally buying it. My biggest hesitation was simple: would it really create quality enough pins to automate my Pinterest workflow in a meaningful way?

The honest answer is no, not fully. At least not yet.

But that does not mean Pin Generator is not worth it. In fact, that is exactly why I think this review matters. If you go in expecting true set-it-and-forget-it Pinterest automation, you may be disappointed. If you go in expecting a tool that dramatically speeds up pin ideation, creation, duplication, and scheduling while still requiring human review, this can be a very strong deal.
See how this score is calculated

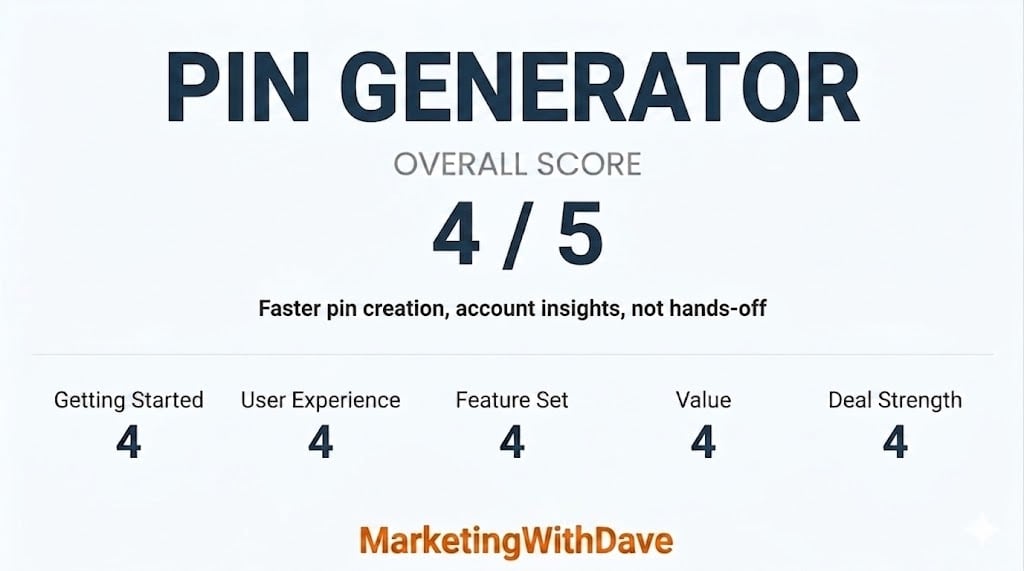
Here’s how to interpret this score:

The overall score reflects both product quality and how compelling the current deal is.

A score in the low-to-mid 4 range reflects a tool that offers real value, especially for Pinterest users, but still has enough workflow limitations and rough edges to keep it from being a 5 out of 5.

See the Pin Generator Deal

Affiliate disclosure: If you buy through my affiliate link, I may earn a small commission at no additional cost to you. I only share tools I believe are worth your time and consideration.

Real Results From My Implementation

I am actively using Pin Generator for my own Pinterest workflow.

What changed for me is not that it magically replaced creative judgment. It did not. What changed is that it made it much faster to produce, test, duplicate, tweak, and publish pins at a scale that would have taken far more manual effort otherwise.

I still review what gets created. I still reject a meaningful percentage of automated outputs. But I also create and publish more pins because of this tool than I would without it.

That matters.
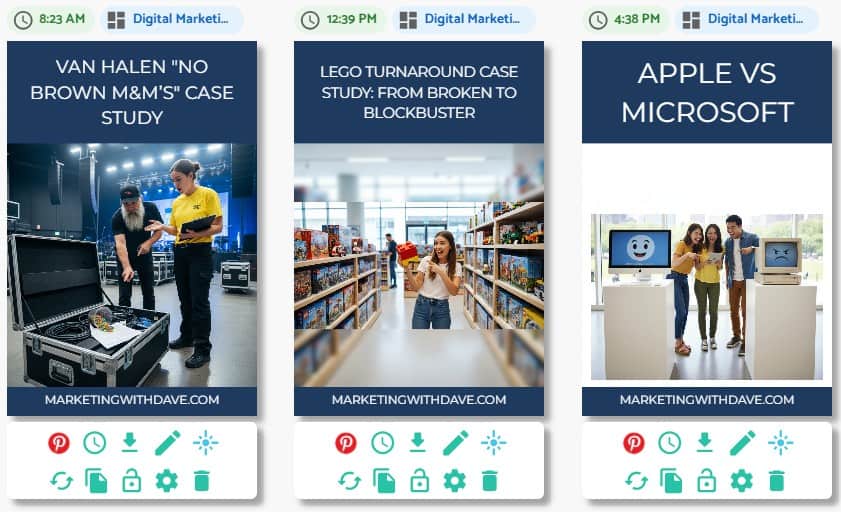
Real Output: Pins generated with Pin Generator, then reviewed, refined, and published

The 30-Second Decision

Best for: people who use Pinterest or want to use Pinterest more seriously

Not ideal for: people who do not plan to use Pinterest consistently or who expect fully polished, publish-ready pins without review

My take: Pin Generator does not eliminate the need for judgment, but it absolutely reduces the time and friction involved in Pinterest marketing. If Pinterest is part of your strategy, this is worth a serious look.

What Pin Generator Actually Does

Pin Generator is built to speed up Pinterest pin creation and scheduling. Highlights include bulk pin generation, bulk editing, bulk scheduling, smart scheduling, custom templates, Canva template imports, AI-assisted title and description remixing, and integrations with tools like Pinterest, WordPress, Shopify, Amazon, and OpenAI.

In simple terms, it helps you go from one URL, product set, or content idea to a much larger batch of possible pins faster than doing everything manually.

That does not mean every generated pin is good. It means you get more starting points, more volume, and more opportunities to refine what is worth publishing.
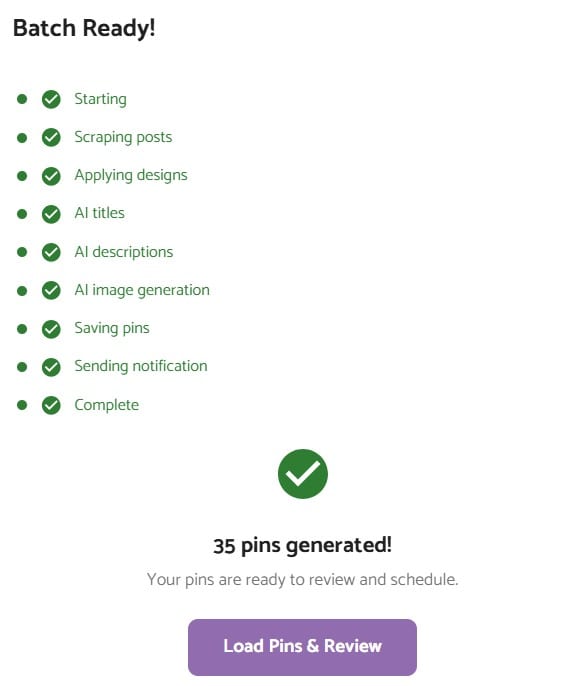
Automation: Generates pins at scale, then prepares them for review and scheduling

This Product Is for You If You Use Pinterest or Want to Use Pinterest

If Pinterest is not part of your strategy and you do not want it to be, this is probably an easy pass.

If Pinterest could drive traffic, awareness, affiliate clicks, blog visits, or product discovery for you, Pin Generator becomes much more interesting.

Yes, Pinterest is often talked about as a more female-heavy platform, but I would not want marketers to dismiss it too quickly. There is still real opportunity there, and this tool is built specifically around helping you move faster inside that channel.

What I Like Most About Pin Generator

1. You can build your own templates and control the process

This is probably the biggest reason I like the tool.

You are not stuck with whatever the AI creates. You can create your own templates, import your own images, and control the creative direction. Once you land on a design you like, it becomes much easier to duplicate, tweak, and publish variations.
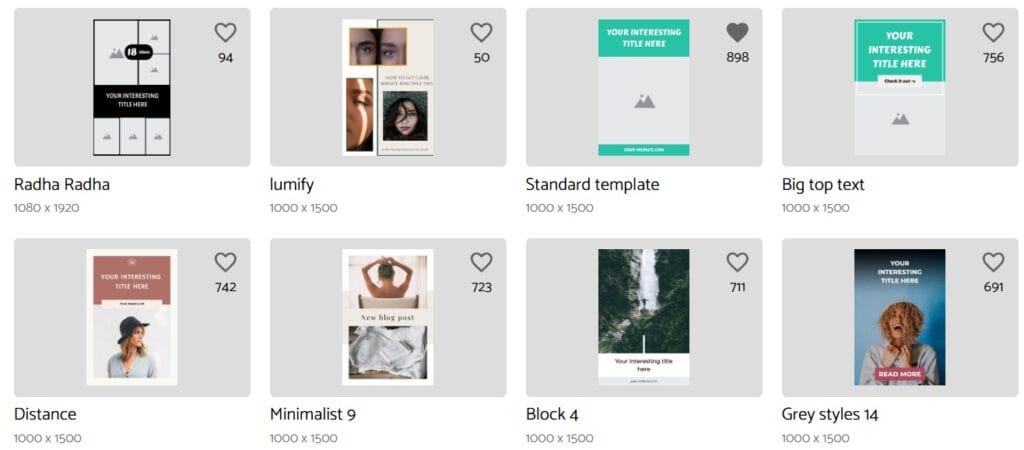
Real Output: Pins generated with Pin Generator, then reviewed, refined, and published

2. The keyword research is useful

One of the better surprises is the keyword research functionality. Seeing suggested terms, related terms, and trending keywords can help shape what pins you create and how you title them.

This is one of the features that helps show the product is not only about design speed. It also helps with topic direction.
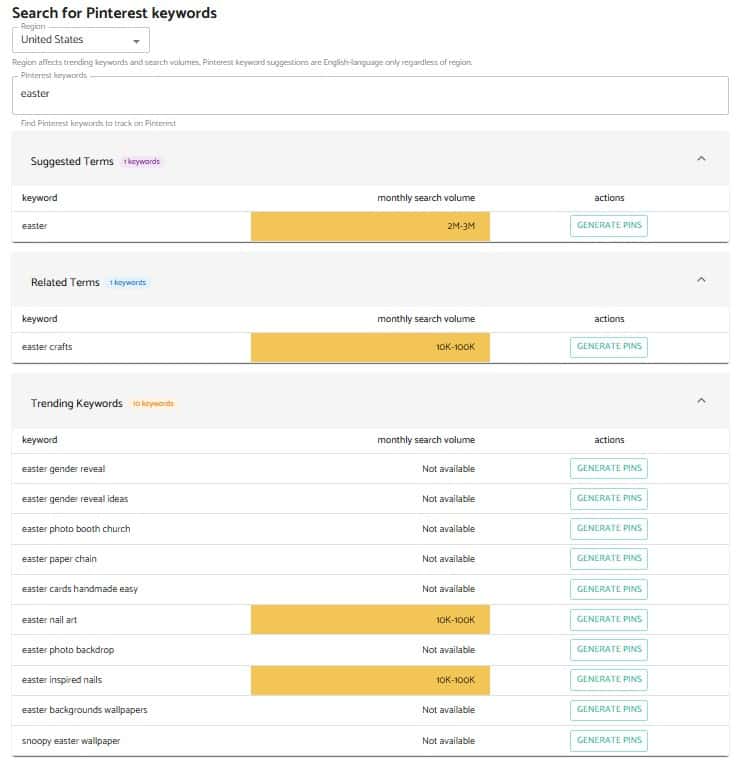
Keyword Research: Discover suggested, related, and trending keywords to guide what pins to create

3. Trend alerts can drive content creation

Getting notified when a keyword or topic is trending is a legitimately useful feature. This has already influenced some of the pins I have created.

Anything that helps connect timing, search interest, and content creation is valuable.
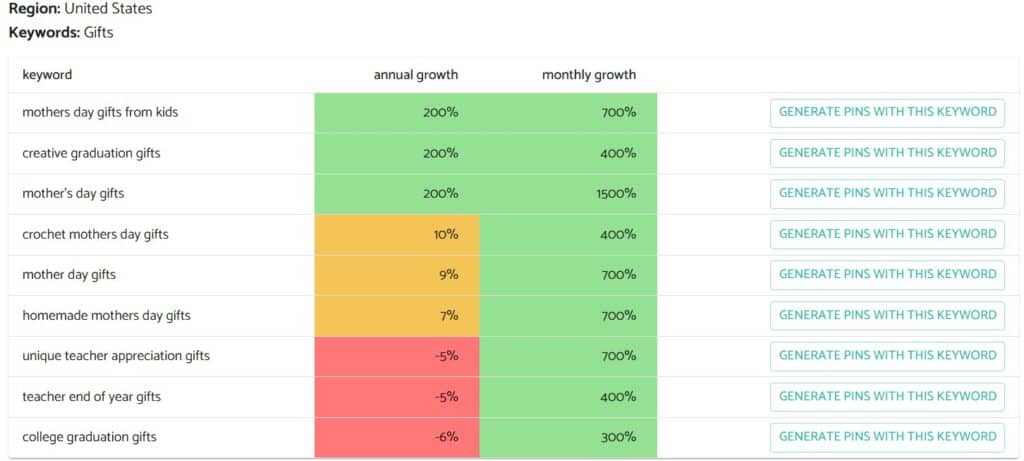
Trending Insights: Spot fast-growing keywords to prioritize what to create next

4. eCommerce support will matter for some users

Pin Generator integrates with platforms like Shopify, Amazon, WordPress, and more, allowing you to pull in your products, images, and data to generate Pinterest pins at scale.

If you are running an eCommerce business, this means you can quickly turn your product catalog into a consistent stream of Pinterest content without creating every pin manually.

It also supports Pinterest catalogs, which allow your pins to include additional product details like pricing and availability, making them more useful for shopping-focused users.

If your goal is to drive traffic or sales from Pinterest using your product catalog, this is one of the more compelling use cases for the tool.

5. The profile audit is genuinely impressive

I love the profile audit.

It gives you a detailed look at your Pinterest account and surfaces ideas for improving reach, engagement, and traffic. There is real value here because this is not the kind of account-level feedback most Pinterest users are getting elsewhere.

This is one of the features that makes the product feel more strategic and less like a simple graphic generator.

View my full Pinterest audit

6. Removing poor-performing pins is interesting, but use caution

The beta feature that removes poorly performing pins is one of those ideas that sounds smart but should be used carefully.

The ability to automatically scan and remove older pins with low impressions could be useful, but I would not treat it casually. Some pins take time, and low visibility does not always mean low long-term value.

Where Pin Generator Still Falls Short

1. This is not true autopilot pinning

This is the biggest thing to understand before buying.

If your goal is to tell the tool to make 21 pins for the next 7 days, quickly approve them, and trust that they are all publish-ready, that is probably not what you are getting.

In my experience, a batch like that may only produce a smaller number of pins worth using right away. That is still useful. It is just not the same thing as full automation.

2. Pinterest API limitations appear to affect the workflow

The most frustrating limitation for me may not even be Pin Generator’s fault. It appears tied to what the Pinterest API allows.

When publishing directly inside Pinterest, you can select categories. With Pin Generator, that does not appear to be available, and I do not know how much that impacts results, but it is one of the biggest reasons I still hesitate to post more directly through the tool.

3. Some automation settings are less flexible than I would like

There are a few workflow details that feel less polished than they should be.

For example, there are settings buried inside the pin creation flow that some users may want more control over, including shopping-related options such as showing similar products.

I also currently have an issue where board and section selection does not always behave the way I expect, even when I intentionally do not want AI making those choices. I am hopeful that gets resolved quickly.

4. You still need a human eye

Even with strong prompts and outside AI help, you will likely reject some outputs, revise others, and only publish a portion of what gets created. That does not make the tool a failure. It just means the role of the tool is acceleration, not replacement.

See the Pin Generator Deal

What Works Well

  • Template flexibility and duplication
  • Faster pin creation once your design direction is dialed in
  • Keyword research and trending topic support
  • Useful profile audit insights
  • Bulk creation and scheduling workflows
  • Good fit for people who want to do more on Pinterest without manually building every pin from scratch

Watch Out For

  • Do not expect every generated pin to be publish-ready
  • Manual review is still part of the process
  • Some workflow friction remains
  • Pinterest API limitations may affect publishing options
  • Automation is helpful, but not fully hands-off

Bottom Line

Pin Generator is not a miracle Pinterest automation machine.

It is a practical Pinterest acceleration tool.

That is the more accurate and more useful way to think about it.

If you want software that helps you generate more pin ideas, create more pin variations, move faster once you have a template you like, and publish more consistently, Pin Generator can absolutely help.

If you want software that eliminates creative review and fully automates quality Pinterest marketing for you, this is probably not there yet.

Still, if you use Pinterest or want to use Pinterest seriously, I think this deal is worth a look.

See the Pin Generator Deal

Disclaimer: This review reflects my experience using the product and my interpretation of the current Pin Generator offer. Always review the latest terms, pricing, and feature details before purchasing.

Looking for more marketing software reviews? See my full list of marketing tools and software I recommend.

Pin Generator Review: AI Pinterest Pin Creation and Scheduling Read More »
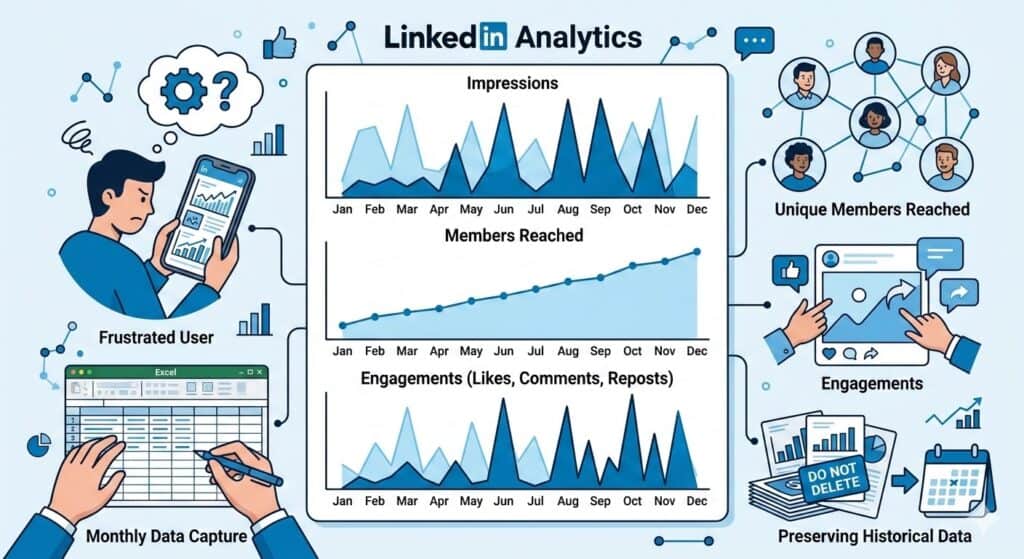
linkedin analytics impressions members reached engagements

LinkedIn Analytics Explained: Impressions, Members Reached, and Engagement Trends

Reading Time: 4 minutes

Why You Rarely See LinkedIn Analytics Shared

I have never seen anyone publicly share their LinkedIn analytics.

I suspect there are two main reasons.

First, the data is surprisingly difficult to gather. LinkedIn only surfaces analytics through the mobile app. If you want monthly trends, you have to manually set the start and end date for each month and record the numbers yourself. For a platform likely worth well over $100 billion, the analytics experience feels incredibly primitive.

Second, LinkedIn is personal. The metrics can feel like a public scoreboard of how good someone is at networking, influence, or business. Most people would rather talk about success than show the full data behind it.

I have never pretended to be a great networker. I do not love the social side of business. What interests me more is the data and the insights we can learn from it.

The Three Metrics LinkedIn Actually Provides

So, I decided to track my LinkedIn analytics manually and share the results.

The platform essentially gives you three core metrics:

  1. impressions
  2. members reached
  3. engagements

That is not a lot to work with. Impressions in particular are often considered a vanity metric, but when that is one of the only signals available, you end up clinging to it anyway.

Limitations of LinkedIn Analytics

Before looking at the charts, there are two additional limitations worth mentioning about LinkedIn’s analytics.

First, LinkedIn only provides data for the most recent 12 months. If you want to track longer term trends, you need to capture the numbers yourself. Once the window moves forward, older data simply disappears. Even if you are not planning to analyze it immediately, it is worth recording the numbers each month so you have the history available later.

Second, LinkedIn’s built in analytics leave out several metrics that are useful for understanding growth. Because of that, I have been experimenting with tracking additional signals outside the platform.

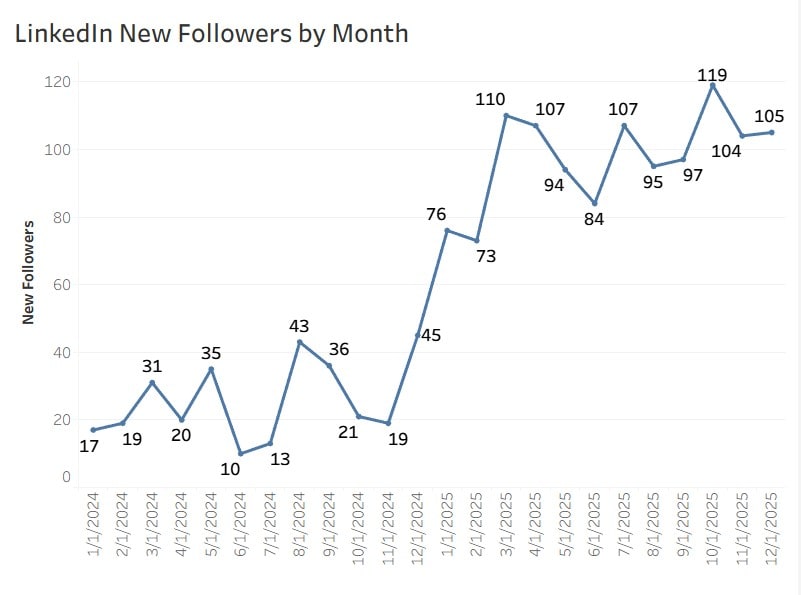
For example, I wrote about a method for tracking monthly LinkedIn follower growth using Excel formulas. Follower growth is one of the few ways to measure whether your audience is actually expanding over time.

Another metric that may relate to these trends is LinkedIn’s Social Selling Index (SSI), which attempts to measure how effectively you build relationships, share insights, and engage with your network.

I suspect there may be interesting relationships between SSI scores, follower growth, impressions, and engagement trends, although LinkedIn does not provide an easy way to analyze them together.

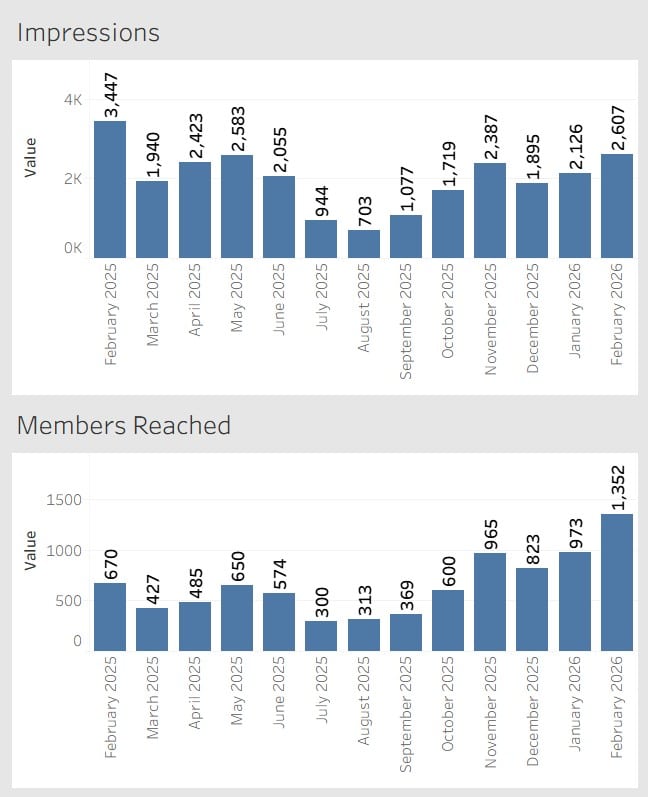
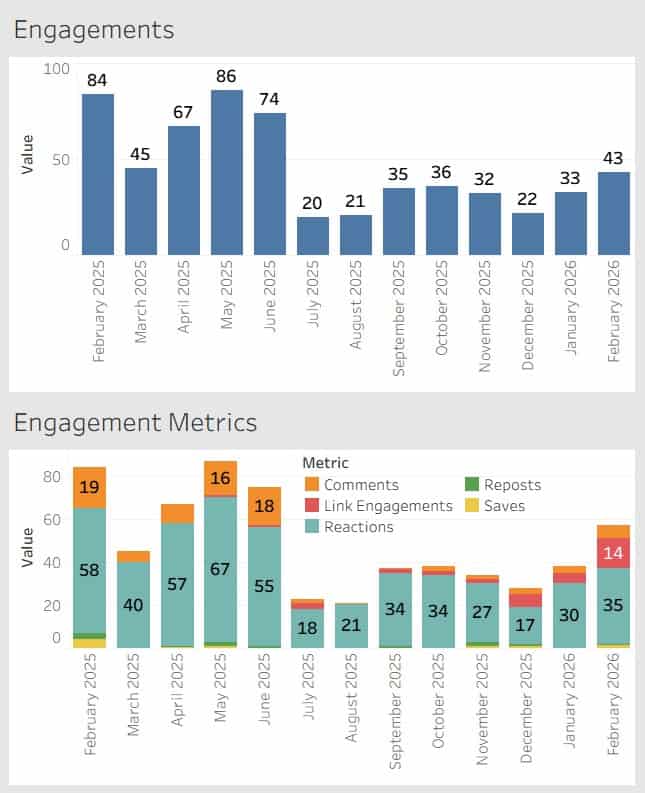
With that context in mind, here are the metrics LinkedIn currently provides.

Observations From the Data

Looking at these charts, a few patterns stand out.

First, impressions are volatile. The numbers fluctuate significantly from month to month without an obvious pattern. Some months see more than triple the impressions of others.

Second, members reached shows a much steadier upward trend. While there are some fluctuations, the overall direction appears to be gradual growth over time.

Third, engagements tend to follow impressions more closely than members reached. When impressions spike, engagement usually rises with it.

One other note for transparency. A portion of the repost activity counted in these numbers comes from my own reposts.

What This Data Does and Does Not Tell Us

With only three primary metrics available, it is difficult to draw strong conclusions.

Impressions tell us how many times content appeared in feeds, but they do not tell us whether people actually consumed the content.

Members reached provides a slightly better signal because it reflects the number of unique individuals exposed to the content.

Engagements provide the most meaningful signal of the three, but even here the data is limited. LinkedIn groups together different types of engagement without providing deeper context around why certain posts perform better than others.

In other words, the data hints at patterns but does not fully explain them.

What This Data Actually Helps You See

Trending these metrics over time does reveal some patterns, but it also highlights how limited LinkedIn analytics really are.

You can see visibility trends through impressions.
You can see how many unique people are exposed to your content through members reached.
You can see whether people interact through engagements.

What you cannot easily see is why.

LinkedIn does not tell you which topics consistently perform better, how your audience is evolving, or how your content strategy influences long-term growth. Even something as basic as exporting and trending this data requires manual work.

So while these metrics provide some direction, they rarely provide clear answers.

Why Trending the Data Still Matters

Despite those limitations, there is still value in tracking these numbers.

Most LinkedIn users never see their analytics over time. The platform shows short windows of performance, but trends only become visible when the data is captured month after month.

Over time you begin to notice patterns such as seasonal changes in activity, how impressions fluctuate, and whether your network is gradually expanding.

Even if the insights are imperfect, trending the data provides far more context than looking at a single post in isolation.

A Simple Recommendation

If you take one action from this article, it should be this.

Once a month, capture your LinkedIn metrics.

Record impressions, members reached, engagements, and follower growth in a simple spreadsheet. LinkedIn only provides a rolling twelve-month window, so historical data disappears unless you save it yourself.

You may not analyze it right away, but future you will be glad the data exists.

LinkedIn Analytics Explained: Impressions, Members Reached, and Engagement Trends Read More »

case study twitter acquisition

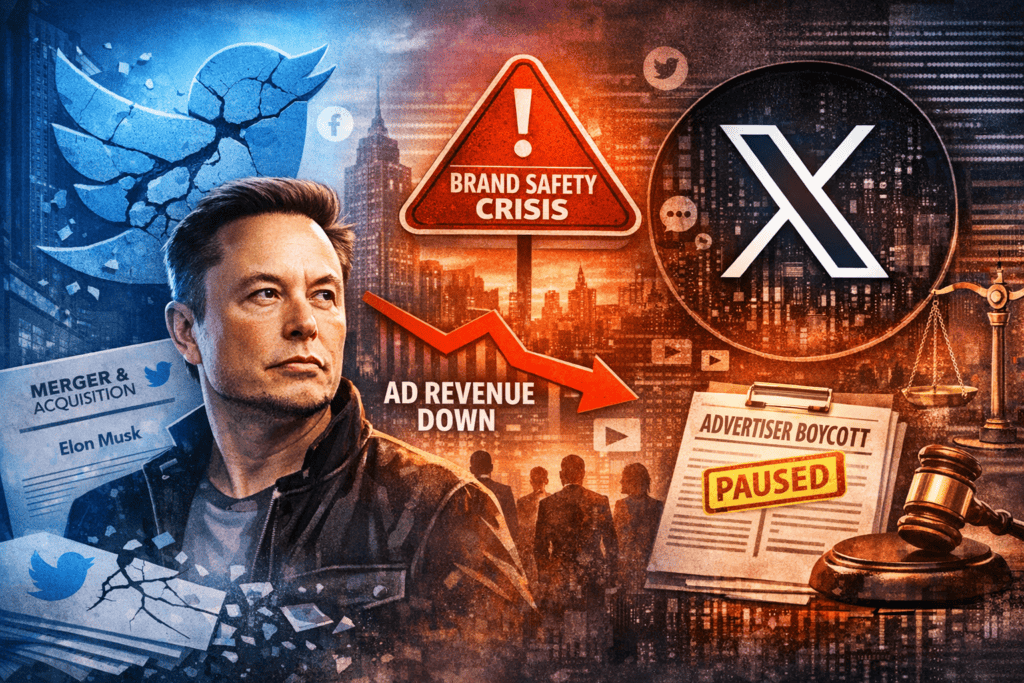
Case Study: Elon Musk’s Twitter Acquisition and the Brand Safety Crisis for Advertisers

Reading Time: 5 minutes

Brief Summary

In 2022, Elon Musk turned an acquisition attempt into a public spectacle: he made an unsolicited bid to buy Twitter, the board deployed a poison pill, the parties signed a deal, litigation followed when he tried to exit, and the transaction ultimately closed in late October 2022.

The marketing lesson is not only about platform volatility.

It is about how quickly advertiser trust can collapse when governance, moderation, verification, and brand identity shift at the same time, and how hard it is to rebuild once brands decide the downside risk is not worth the reach.

Company Involved and Marketing Topic

Company involved: Twitter, Inc., later reorganized under X Corp. The platform was historically advertising-led: Twitter reported in its 2021 annual filing that advertising services were 89 percent of revenue.

Company website: X

Marketing topic: Branding, crisis response, and advertising trust.

Public Reaction or Consequences

Advertiser anxiety was visible before the deal even closed. In an open message to advertisers on the eve of closing, Musk argued he did not want the platform to become a “free-for-all hellscape” and positioned it as a “common digital town square,” implicitly acknowledging that ad dollars depend on controlled risk.

After the acquisition, several changes compounded marketers’ concerns. Ad market data and reporting described deep pullbacks soon after the takeover, including steep declines in ad spending and a broad pause by top advertisers. Verification and checkmark changes increased impersonation risk for brands. The Twitter-to-X rebrand added confusion and threatened long-built brand equity. In 2024, X escalated conflict with advertisers through a lawsuit alleging an unlawful boycott tied to brand safety standards.

Why It Matters Today

• Brand safety is now treated like supply chain risk: measurable, modeled, and acted upon quickly when governance changes raise adjacency concerns.

• Marketer trust metrics shifted in a durable way. Kantar reported historically low trust and perceived brand safety for X, plus a net 26 percent of marketers planning to reduce spend on X in 2025.

• Platform identity can change faster than marketing planning cycles. The abrupt Twitter-to-X rebrand is a reminder that naming and creative conventions can be disrupted quickly.

• AI integration raises new questions about data use and distribution power. By 2025, Musk’s AI company acquired X and framed the value around shared data, models, compute, distribution, and talent. In early 2026, reporting described further consolidation via a SpaceX and xAI deal.

Takeaways and Notable Quotes

Takeaways for marketers:

1) Treat platform stability as a core buying variable. If policies and leadership direction swing overnight, price that volatility into spend and brand safety requirements.

2) Build an exit-ready paid and organic playbook. Use pre-approved criteria for pausing and reallocating when trust signals drop.

3) Protect distinctive brand assets. The Twitter-to-X transition shows how much value lives in name recognition and cultural habits, and how quickly those can be disrupted.

Notable quotes and data:

• “the bird is freed” from Musk when the deal closed.

• Twitter’s 2021 filing reported advertising services represented 89 percent of revenue.

• Kantar reported only 4 percent of marketers believe ads on X provide brand safety, and marketer trust in ads on X fell from 22 percent in 2022 to 12 percent in 2024.

One sentence takeaway: When a platform’s leadership, policies, and identity change at once, marketers stop buying reach and start buying risk reduction.

Full Case Narrative

Twitter entered 2022 as an advertising driven social platform with global cultural influence and a revenue model heavily dependent on brand advertisers. Most of its revenue came from advertising, and marketer trust in content moderation, adjacency controls, and platform governance played a direct role in media buying decisions. Large brands and agencies evaluated Twitter not only on audience reach, but also on brand safety signals, enforcement policies, and third party measurement support.

In April 2022, Elon Musk disclosed a significant ownership stake and made an unsolicited offer to acquire the company. Twitter’s board responded with a shareholder rights plan designed to slow or deter a hostile takeover attempt. On April 25, 2022, Twitter accepted a merger agreement at 54.20 dollars per share. The proposed acquisition quickly became both a financial and governance story, with public debate around spam accounts, platform transparency, and content moderation philosophy. By July 2022, Musk issued a termination notice, and Twitter filed suit in Delaware to enforce the agreement, turning the acquisition into a high profile legal and reputational battle.

For marketers, uncertainty during this period was not abstract. Platform governance and moderation direction directly affect where ads appear and what content they may appear next to. As the dispute and public criticism escalated, advertisers and agency groups began reassessing platform risk. Brand safety frameworks used by major advertisers rely on predictable policy enforcement, third party verification partners, and consistent rule application. Signals that those systems might change created hesitation in media planning and brand placement decisions.

When the transaction closed in late October 2022, reporting described immediate leadership changes, staffing reductions, and rapid product and policy shifts. Several major advertisers paused or reduced spend shortly after closing, citing brand safety and policy clarity concerns. Agency holding companies and brand safety organizations issued updated guidance to clients about risk controls, adjacency filters, and campaign monitoring on the platform. Industry reporting later described a significant decline in United States advertising revenue following the acquisition, reinforcing how sensitive advertiser behavior is to governance and moderation signals.

In July 2023, Twitter rebranded as X, replacing its long standing name and bird logo with a new identity tied to a broader “everything app” vision. From a marketing perspective, this represented a major brand equity reset. The Twitter name carried strong global recognition and established advertiser associations. The X rebrand introduced both strategic flexibility and brand recognition risk, requiring advertisers and agencies to reevaluate platform positioning, audience expectations, and long term fit within media mixes.

Tensions between platform leadership and advertiser groups continued into 2024, including legal action by X against an advertiser trade group and several brands related to coordinated brand safety standards and alleged boycotts. These conflicts highlighted a structural reality for marketers. Platforms depend on advertiser trust and spend, while advertisers depend on platform safety controls and policy transparency. When that balance is strained, marketing investment becomes more volatile and more diversified across channels.

Subsequent consolidation involving X, xAI, and related companies further shifted how analysts and marketers evaluated the platform. The integration narrative emphasized data, distribution, and ecosystem leverage rather than traditional social media advertising alone. For marketers, the case illustrates how platform ownership, governance philosophy, and brand positioning changes can quickly alter advertiser risk models, media allocation decisions, and brand safety requirements.

What Happened Next?

Marketer confidence stayed fragile for years. Kantar findings pointed to continued pullback intent and very low perceived brand safety. The advertiser relationship moved from cautious engagement to public legal conflict through a 2024 antitrust lawsuit. Strategically, the ownership thesis evolved as X was acquired by Musk’s AI company in 2025, framing the platform as a data and distribution asset for AI development. In early 2026, reporting described another consolidation step involving SpaceX and xAI, reinforcing that the platform’s direction is tied to a broader AI and infrastructure narrative, not only social media advertising.

Sources and Citations

US Securities and Exchange Commission: Twitter 2021 Form 10-K

Reuters: Twitter adopts poison pill (shareholder rights plan)

Reuters: Musk completes acquisition and begins leadership overhaul

US SEC filing: DEFA14A describing merger agreement and process

Courthouse News: Twitter v. Musk complaint PDF

Reuters: Ad spending fell 71 percent in December 2022 (Standard Media Index data)

Reuters: Top advertisers pulled back after takeover (Pathmatics estimates)

Reuters: Paid verification and impersonation risk for brands

Reuters: Twitter rebrands as X and the ad industry reaction

Kantar: Media Reactions 2024 findings on X ad pullback and brand safety perceptions

Reuters: X sues advertiser alliance and brands over alleged boycott

CourtListener: Docket: X Corp v. World Federation of Advertisers

Reuters: xAI acquires X (deal framing around data and distribution)

Reuters: SpaceX and xAI consolidation reported in early 2026

Case Study: Elon Musk’s Twitter Acquisition and the Brand Safety Crisis for Advertisers Read More »

how to track linkedin monthly new followers

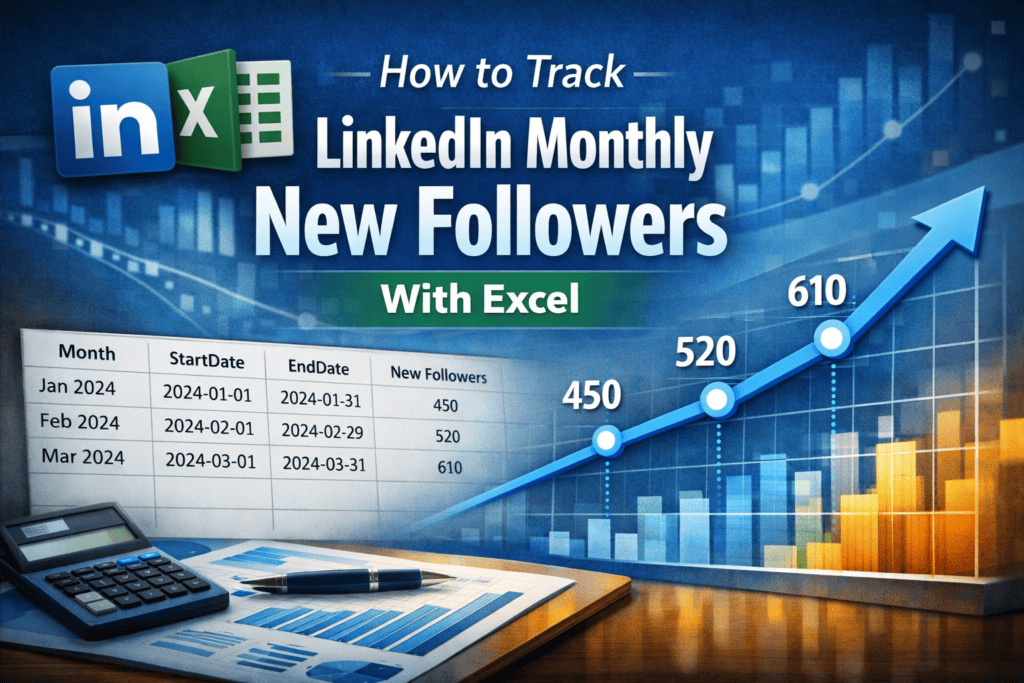
How to Track LinkedIn Monthly New Followers With Excel

Reading Time: 5 minutes

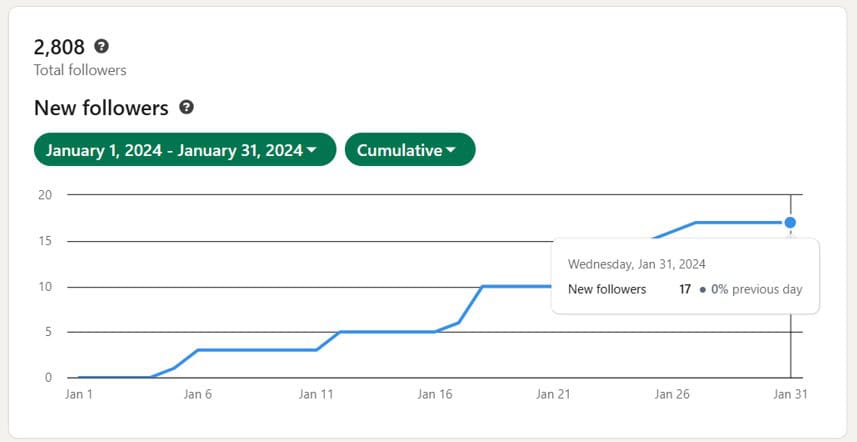
Quick summary: LinkedIn does not provide an export for personal follower analytics, but the Creator Audience analytics view supports custom date ranges. By generating monthly links with Excel formulas, you can capture cumulative new followers by month and build a trend dataset for dashboards and reporting.

LinkedIn’s Creator Audience view can show cumulative follower growth over custom date ranges, and it often provides a deeper lookback window than other profile metrics (which frequently only go back about a year). This quick Excel hack helps you generate a clickable URL for every month so you can capture monthly new followers in minutes and build a trend dataset for Tableau, Excel charts, or reporting.

In this tutorial, you will:

1. Create a simple Excel table with month start and end dates

2. Automatically generate correct month boundaries, including leap years

3. Build a monthly LinkedIn Creator Analytics link for each month

4. Capture monthly new follower totals from the cumulative chart

Important note about this method

This is not an officially documented LinkedIn export feature. It is a repeatable workflow based on how LinkedIn’s Creator Audience analytics URL parameters behave in the browser. LinkedIn can change these parameters or the analytics experience at any time. Use this as a practical workaround for building your own dataset.

What you need

1. A LinkedIn account with access to Creator Analytics

2. A desktop browser (recommended)

3. Excel or Google Sheets (Excel formulas below)

4. A place to record monthly results (a spreadsheet is perfect)

Step 1: Confirm you can access the Creator Audience analytics view

Open LinkedIn in a desktop browser while logged in, then paste this into your address bar:

https://www.linkedin.com/analytics/creator/audience

If you can see an audience analytics view, you are in the right place. If you do not have access, you may need to enable Creator Mode or you may not have this feature available in your account.

Step 2: Understand the URL pattern we will generate in Excel

LinkedIn’s Creator Audience analytics supports custom date ranges via URL parameters. The key parameters used in this workflow are:

startDate=YYYY-MM-DD

endDate=YYYY-MM-DD

timeRange=custom

lineChartType=cumulative

We will use Excel to generate a monthly link for each month so you can open the link, confirm the date range, and capture the cumulative new follower value for that month.

Step 3: Set up your Excel table

Create a new Excel sheet with these column headers:

A: Month
B: StartDate
C: EndDate
D: Link
E: New Followers (entered manually)

In cell B2, enter the first month start date you want to track. Example:

2024-01-01

Make sure columns B and C are formatted as dates.

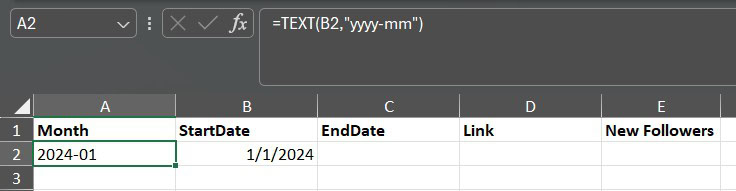
In cell A2, generate your Month label from the StartDate. This helps with sorting and makes the table easier to scan while you build it.

Option 1 (best for Tableau sorting):

=TEXT(B2,”yyyy-mm”)

Option 2 (more readable):

=TEXT(B2,”mmm yyyy”)

You can copy the Month formula down after you fill your StartDate column in the next step.

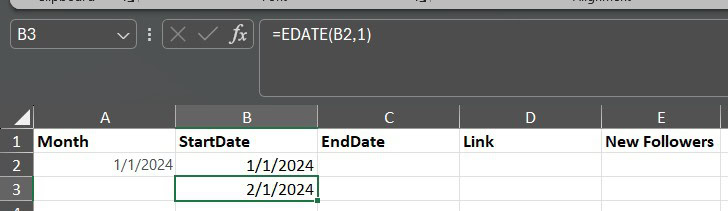
Step 4: Generate the next month StartDate automatically

In cell B3, enter this formula:

=EDATE(B2,1)

Copy B3 down to generate future months. This advances by exactly one calendar month and handles year changes automatically.

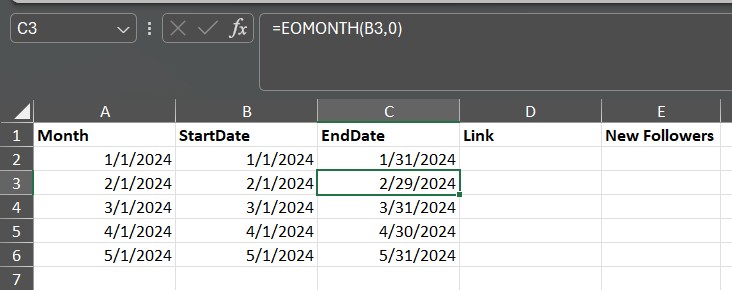
Step 5: Generate the month EndDate automatically

In cell C2, enter this formula:

=EOMONTH(B2,0)

Copy C2 down for all rows. This automatically returns the last day of each month, including February 29 during leap years.

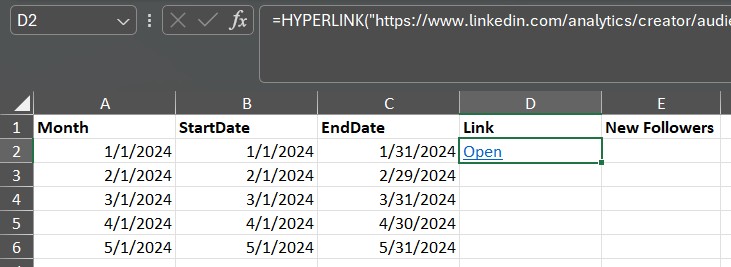
Step 6: Create a clickable monthly analytics link

In cell D2, use this formula to generate a clean, clickable link labeled Open:

=HYPERLINK(“https://www.linkedin.com/analytics/creator/audience/?startDate=”&TEXT(B2,”yyyy-mm-dd”)&”&endDate=”&TEXT(C2,”yyyy-mm-dd”)&”&timeRange=custom&lineChartType=cumulative”,”Open”)

Copy D2 down for all rows.

Copy A2 down for all rows.

Step 7: Capture monthly new follower totals

For each month (each row):

  1. Click the Open link in column D
  2. Confirm the date range matches the month you are tracking
  3. Confirm the chart is in cumulative mode
  4. Hover the last point on the chart and record the cumulative new follower value
  5. Enter that value in column E (New Followers)

Recommended tracking protocol

To keep your dataset consistent, run this process on the first day of each month for the prior month. Example: capture January’s value on February 1. If you do it mid-month, your interpretation of month-to-month changes becomes less clean.

How to use the dataset

Once you have monthly values, you can:

1. Create a line chart of New Followers by Month

2. Add a rolling 3-month average to smooth spikes

3. Compare follower growth to your posting frequency (if you track it)

4. Use the dataset in Tableau for a dashboard and blog content

Common troubleshooting

1. Excel shows numbers like 45322 instead of a date

This usually means the cell is formatted as a number. Change the column format to a date (Home menu, Number format, choose Short Date or Date).

2. The link opens but the date range does not look right

Make sure your StartDate and EndDate cells are true dates, and confirm the TEXT format in the formula is exactly yyyy-mm-dd.

3. You cannot access the Creator Audience analytics view

Your account may not have Creator Analytics enabled or available. Try enabling Creator Mode and then revisit the URL.

4. You do not see cumulative mode

LinkedIn occasionally changes analytics UI elements. If the view still shows follower growth but the cumulative toggle looks different, capture the monthly total using the last visible value in the chart.

Limitations to understand up front

LinkedIn personal profile analytics are not designed for exporting and trending. This method works best for follower growth because the Creator Audience view can provide a deeper history window than other profile metrics. Other personal profile metrics may not support consistent month-by-month extraction and may only be visible for shorter windows.

If you build a dashboard from this, document your capture schedule and save occasional screenshots so you have a clear audit trail for how the dataset was created.

Frequently asked questions

Does LinkedIn provide an official export for follower analytics?

No. Personal profile analytics do not currently support any export options. This method uses the Creator Audience analytics view with custom date ranges.

Does this work for company web pages?

Company web pages have built-in analytics exports. This method is most useful for personal profiles where export is not available.

How to Track LinkedIn Monthly New Followers With Excel Read More »

case study united airlines passenger dragged crisis

Case Study: United Airlines and the Passenger Dragging PR Crisis

Reading Time: 3 minutes

Brief Summary

In April 2017, United Airlines faced a massive public relations crisis after a paying passenger was violently dragged off an overbooked flight by airport security.

Video footage of the bloodied passenger went viral worldwide, sparking international outrage and calls for change.

The incident quickly became a textbook example of how a single customer service failure can erupt into a global reputational nightmare, underscoring the importance of empathy and swift crisis management in modern marketing.

Company Involved

United Airlines is the major American airline at the center of this story, headquartered in Chicago and one of the world’s largest carriers.

Marketing Topic

The primary themes in this case are Customer Experience and Crisis Response, showcasing how frontline behavior and initial brand messaging can influence global perception, trust and long-term reputation.

Public Reaction or Consequences

The reaction was overwhelmingly negative. The video became the top trending topic on Chinese social platform Weibo with over 580 million posts. Outrage escalated into viral calls to boycott United, politicians demanded investigations into overbooking, and the airline’s approval rating dropped below the U.S. president’s at the time. The stock price initially fell and the company reached a legal settlement with Dr. Dao within weeks. The brand damage was severe and long-lasting.

Why It Matters Today

This moment showed that public backlash can scale globally in hours, that customer treatment outweighs advertising spend, that corporate tone determines public reception, and that crisis response must prioritize humans before statements. It also forced the airline industry to change policies and rethink involuntary passenger removal.

3 Takeaways

1. Customer experience outweighs messaging, slogans, campaigns and brand claims.

2. A fast, human, accountable response beats a slow, scripted or defensive statement.

3. Empowering employees to resolve conflict prevents global brand crises.

Notable Quotes and Data

“No one should ever be mistreated this way.” United CEO Oscar Munoz, public apology.

“United Airlines was more unpopular than Donald Trump.” Newsweek public sentiment report.

United introduced compensation up to $10,000 to avoid involuntary bumping.

Full Case Narrative

On April 9, 2017, United Airlines Flight 3411 was overbooked because four crew members needed seats. No passengers accepted a $800 voucher to volunteer to leave the flight. The airline then involuntarily selected four passengers. One of them, Dr. David Dao, a 69-year-old physician, refused to give up his seat, explaining he had patients to treat the next day.

Security officers were called to remove him. During the removal, his face struck an armrest, knocking him unconscious, bloodying him and causing significant visible injuries. Other passengers recorded the event, including footage of his limp body being dragged down the aisle. The video spread across social media within hours, triggering global outrage.

The next day, United released a statement apologizing for “re-accommodating” passengers, a phrase that was widely criticized as minimizing the incident. A leaked internal memo described Dr. Dao as “belligerent,” further escalating backlash. Public outrage intensified, leading to #BoycottUnited and unprecedented media coverage.

The CEO later released a public apology calling the incident “truly horrific,” acknowledging wrongdoing, promising it would never happen again, and launching a formal policy review. Within 18 days, the company settled with Dr. Dao for an undisclosed sum and introduced major policy changes, including banning forcible removals of seated passengers, increasing volunteer compensation up to $10,000, retraining staff, and shifting internal incentives toward customer experience outcomes instead of operational targets alone.

This crisis revealed a systemic cultural issue: frontline staff were following policy, not solving a human problem. The controversy demonstrated that internal procedure must never override customer dignity, safety or emotional intelligence. Years of branding, advertising and loyalty incentives were overshadowed by a single recorded moment.

Timeline

April 9, 2017: Incident occurs onboard United Flight 3411 and is recorded by passengers.

April 10, 2017: United issues its first statement referencing “re-accommodation,” triggering backlash.

April 11, 2017: CEO issues a full apology, calling the event horrific and unacceptable.

April 27, 2017: United announces settlement with Dr. Dao and major policy overhauls.

What Happened Next?

Security officers involved were later fired or suspended. Airlines across the U.S. updated overbooking policies, increased voluntary compensation, and reduced involuntary removals. Customer complaints dropped significantly year-over-year after the incident. United rebuilt operational policy, internal culture, incentives and training to prioritize dignity over rigid protocol. The incident remains a landmark case in PR, crisis communication, customer experience and corporate accountability.

One Sentence Takeaway

One customer moment, captured and shared, can outweigh decades of brand investment, advertising spend and loyalty building.

References

Newsweek: David Dao settlement report

Los Angeles Times: United policy changes

Al Jazeera: Official apology coverage

CBS News: CEO interview and quotes

WTTW Chicago: Long-term industry impact

WTTW Chicago: Officer terminations

Case Study: United Airlines and the Passenger Dragging PR Crisis Read More »

case study oreo dunk in the dark

Case Study: Oreo’s “Dunk in the Dark” – Real-Time Marketing That Won the Super Bowl

Reading Time: 6 minutes

Brief Summary

During Super Bowl XLVII on February 3, 2013, a sudden 34-minute power outage plunged the stadium into darkness. Oreo’s social media team immediately seized the moment: within minutes they tweeted an image of a single Oreo cookie on a dark background with the caption “Power Out? No problem. You can still dunk in the dark.”

This quick-witted real-time response quickly went viral, earning thousands of social shares and extensive media coverage. The incident is celebrated as one of the most iconic examples of agile, creative social media marketing.

Company Involved

Oreo is a popular sandwich cookie brand owned by Mondelēz International (formerly Kraft/Nabisco). In this case study, Oreo’s marketing and social media agencies played key roles. The work was led by Leo Morejon and a 15-person team at the digital agency 360i, in coordination with partners such as Wieden+Kennedy, Mediavest, and Weber Shandwick. This multi-agency “war room” was assembled to support Oreo during the Super Bowl, preparing to respond to any breaking moment in real time.

Marketing Topic

This case exemplifies real-time social media marketing and “newsjacking” during live events. Rather than relying on a traditional Super Bowl TV ad, Oreo capitalized on an unexpected cultural event (the power outage) to amplify its brand message. The campaign demonstrates how brands can use social media and agile content strategies to engage audiences instantly, aligning marketing communications with current events as they unfold.

Public Reaction or Consequences

The public reaction was overwhelmingly positive. Oreo’s tweet was celebrated for its humor and timing, and it rapidly became a viral sensation. In the hour after posting, the tweet received over 10,000 retweets and 18,000 likes, with similar high engagement on Facebook. Media outlets around the world praised the stunt – some called it “one of the most buzz-worthy ads of the Super Bowl” even though it was not a paid commercial. The campaign earned Oreo millions of free media impressions (estimated at over USD 525 million) and hundreds of news headlines globally. It also won industry awards: Oreo and its agency 360i received a Cannes Silver Lion for Best Use of Digital Direct Marketing and a Bronze Lion for Best Viral Advertising. Overall, consumers saw Oreo as a clever and agile brand, and many marketers studied the case, often referring to an “Oreo moment” when discussing real-time social marketing.

Why It Matters Today

This event remains a landmark example of the power of real-time marketing and social media engagement. It showed that even a small, reactive post can achieve massive impact if it is timely and on-brand. Marketers today still reference Oreo’s blackout tweet as a benchmark: being prepared to respond in seconds to trending events can greatly boost visibility and brand affinity. The “Dunk in the Dark” case is frequently taught in marketing courses as evidence that bold creativity and speed can turn unexpected situations into marketing victories. In an era of second-screen viewing and instant communication, Oreo’s success highlights why brands invest in social listening and prepared “war rooms” to capture cultural moments.

3 Takeaways

1. **Speed and Relevance Matter:** Oreo’s team was ready to move within minutes. Being prepared to react instantly to real-world events can capture audience attention more effectively than pre-scheduled ads.

2. **Simplicity is Powerful:** A short, witty message paired with a clear visual (the Oreo cookie) resonated widely. Even minimal text – just a few words – made the tweet memorable and highly shareable.

3. **Preparation Pays Off:** The Oreo team had trained for real-time marketing (for example, through prior campaigns like “Daily Twist”) and set up an on-site command center. This preparation – including planning alternate versions of the tweet – enabled them to execute flawlessly under pressure.

Notable Quotes and Data

“Power Out? No problem. You can still dunk in the dark.” – Oreo’s tweeted caption (Feb 2013)

“It was the tweet heard around the world, with over 15,000 retweets…” – Digiday recounting the campaign

“It definitely makes the brand seem like a more clever, more interesting, sharp brand.” – Marketing professor Jonah Berger on Oreo’s real-time marketing

15,000 retweets; 20,000 Facebook likes; USD 525 million in earned media impressions

Cannes Lions 2013: Silver (Digital Direct Marketing), Bronze (Viral Advertising)

Full Case Narrative

On February 3, 2013, during Super Bowl XLVII in New Orleans, a power outage suddenly darkened the stadium. As nearly 70 million viewers tuned in, Oreo’s social media team quickly recognized a unique opportunity. Within minutes of the outage, the Oreo Twitter account posted an image of a lone Oreo cookie against a dark background, captioned with the now-famous line: “Power Out? No problem. You can still dunk in the dark.” This quick, tongue-in-cheek response turned a brief unexpected event into a marketing moment.

The Oreo team had anticipated the need to react rapidly. They had set up a Super Bowl “war room” with writers, designers, and strategists on standby. According to reports, the group even prepared alternate tweet images ahead of time (one in team colors for each Super Bowl finalist). When the blackout occurred around 8:46 p.m., the team met the challenge in under two minutes. The timely post immediately drew attention, showing how pre-planning and an empowered social team can capitalize on breaking news.

The tweet went viral almost instantly. As Wired reported, it accumulated nearly 15,000 retweets and 20,000 Facebook likes within an hour:contentReference[oaicite:7]{index=7}. Fans and journalists enthusiastically shared the image; Tumblr users even proclaimed “Oreo won the Super Bowl blackout.” This real-time engagement far exceeded the exposure of many traditional ads. Oreo’s social followers spiked (about 8,000 new Twitter followers and tens of thousands of Instagram followers in the days following), and thousands of user-generated photos of Oreo cookies flooded social networks.

This success was built on Oreo’s already-strong digital presence. The brand had spent the year leading up to the Super Bowl on creative social projects (including a 100-day “Daily Twist” campaign celebrating its 100th anniversary). As 360i’s CEO later explained, Oreo had “muscle memory” for commenting on culture because of that work:contentReference[oaicite:8]{index=8}:contentReference[oaicite:9]{index=9}. The blackout tweet, while spontaneous in feel, was actually the result of careful strategy and rehearsal. The combination of speed, cultural relevance, and a message aligned with Oreo’s brand identity made the stunt legendary.

The campaign won instant acclaim. Industry judges awarded Oreo two Cannes Lions for the effort, and marketing experts frequently cite the tweet as a defining example of modern advertising. In hindsight, the “Dunk in the Dark” campaign is often described as a turning point, illustrating how a nimble social strategy can match or outperform expensive ad buys. The immediate success cemented Oreo’s reputation as an innovative, consumer-savvy brand and influenced how companies plan Super Bowl marketing.

Timeline

Feb 3, 2013: During Super Bowl XLVII in New Orleans, a 34-minute power outage occurs in the third quarter. At about 8:48 p.m., Oreo’s social media team tweets its blackout image (“You can still dunk in the dark”).

Feb 3, 2013 (minutes later): The tweet begins to spread rapidly. By 9:00 p.m., social metrics show over 10,000 retweets and 18,000 likes, and the post is being shared by media outlets and fans worldwide:contentReference.

Feb 4, 2013: News articles and blog posts highlight Oreo’s tweet as a brilliant real-time marketing move. Social media analysis shows a significant increase in Oreo’s followers and engagement. The campaign becomes a trending topic.

June 2013: At the Cannes Lions Festival, Oreo (and 360i) wins a Silver Lion (Digital Direct Marketing) and a Bronze Lion (Viral Advertising) for the blackout tweet campaign.

2013–2025: The “Dunk in the Dark” tweet remains a teaching example in marketing and a benchmark for real-time social strategies. Oreo continues creative social campaigns, and other brands attempt similar real-time responses during events (often citing the Oreo example).

What Happened Next?

Following the Super Bowl success, Oreo’s marketing team built on its social momentum. The brand continued to engage consumers with creative content (such as holiday-themed posts and interactive apps) that leveraged its high profile. The concept of real-time marketing gained traction in the industry: brands set up dedicated teams and war rooms for events, hoping to replicate Oreo’s agility. Some succeeded with witty social posts, while others learned that timing and relevance are critical. Meanwhile, Oreo’s tweet entered advertising lore; marketers frequently reference the “dunk in the dark” moment as inspiration. The campaign also influenced Oreo’s parent company, Mondelēz, to keep prioritizing digital and social initiatives.

One Sentence Takeaway

Quick, clever social media posts that tap into current events can achieve tremendous engagement and brand impact, often far surpassing traditional ads.

Sources and Citations

Angela Watercutter, “How Oreo Won the Marketing Super Bowl With a Timely Blackout Ad on Twitter,” Wired (Feb 2013)

Valens Research, “Dunk in the Dark – A single tweet is all this brand needed to win the Big Game,” (2016)

Shareen Pathak, “The definitive oral history of the Oreo ‘You can still dunk in the dark’ Super Bowl tweet,” Digiday (Feb 2017)

Morten Strand, “The Impact of Real Time Marketing: How to Implement Real Time Market Research,” Digital Marketing Magazine (Apr 2015)

Leo Morejon, “Oreo Super Bowl Blackout Tweet: A Case Study (2025 Edition),” LeonardoM.com (2025)

Case Study: Oreo’s “Dunk in the Dark” – Real-Time Marketing That Won the Super Bowl Read More »