Strategy

case study nordstrom tires returned

Case Study: How Nordstrom’s Tire Return Became a Branding Legend with Limits

Reading Time: 3 minutes

Brief Summary

Vintage-style satire image of Nordstrom tire return

In the 1970s, a customer returned a set of used tires to a Nordstrom store in Fairbanks, Alaska. The store accepted the return, even though Nordstrom never sold tires, because the location used to be a different retailer.

This story became part of Nordstrom’s brand legend, representing exceptional service. However, it also highlights the importance of boundaries in customer experience strategies.

Company Involved

Nordstrom

Marketing Topic

  • Customer Experience
  • Branding
  • Company Culture

Public Reaction or Consequences

The story spread through business books, service training programs, and company folklore. Many praised Nordstrom for putting the customer first. The tire itself is displayed in Nordstrom’s flagship store in New York City. While it earned admiration, it also raised questions about where a company should draw the line in meeting customer requests.

Why It Matters Today

• Highlights how brand legends can shape perception over decades
• Reminds marketers that every story sets a precedent
• Shows the risk of viral anecdotes becoming unrealistic expectations
• Relevant in today’s culture of transparency, reviews, and employee autonomy

3 Takeaways

  1. Service stories can build brand equity that lasts for decades
  2. Employees should be empowered, but also trained to use sound judgment
  3. Legendary moments should inspire culture, not override policy and reason

Notable Quotes and Data

  • “We are known for our policy that we take everything back … but it boils down to the customer and how we take care of them” — Pete Nordstrom
  • “He called a local Firestone dealer to determine a fair price and gave the customer a refund” — Jeff Toister, customer service consultant
  • “Yes, this is a true story” — Seattle Refined

Full Case Narrative

In the mid-1970s, Nordstrom acquired a location in Fairbanks, Alaska that had previously operated as a department store selling everything from clothing to car tires. Some time after the acquisition, a customer walked in to return a pair of worn tires. Although Nordstrom never sold tires, a young associate named Craig Trounce honored the request. He called a local Firestone dealer, calculated a fair refund, and processed the return for about 25 dollars.

Rather than being reprimanded, Trounce was praised for delivering excellent customer service. The story was later confirmed and celebrated by Nordstrom executives, including Pete Nordstrom on the company’s podcast. The tire return became a symbol of Nordstrom’s customer-first mentality and was shared widely in management seminars and business books.

Still, the story is not just about generosity. It raises an important question for marketers and company leaders: what happens when legendary moments create unrealistic expectations? Nordstrom has continued to promote autonomy within clear service standards. The tire story lives on, but the brand does not promise to accept all outlandish requests. The goal is thoughtful service, not boundless concessions.

Timeline

  • Mid-1970s: Nordstrom acquires Fairbanks, Alaska location from a previous retailer
  • Late 1970s: Customer returns tires, associate refunds ~$25
  • 2010s–2020s: Story is confirmed by executives and displayed in stores

What Happened Next?

Nordstrom embraced the story as part of its brand identity, using it in employee training and customer engagement. The tire became a literal and symbolic display in stores. Internally, Nordstrom continued to encourage service with discretion. The company now balances generous service with realistic guidelines to avoid being taken advantage of.

One Sentence Takeaway

Exceptional customer service can define a brand, but only when supported by thoughtful boundaries and clear expectations.

Sources and Citations

The Nordy Pod: The Truth About Nordstrom’s Legendary Tire Story

The man behind Nordstrom’s famous “tire story” – Axios

Is the Nordstrom ‘tire refund’ legend real? We have answers!

How to use inspiring stories to grow your service culture – Jeff Toister

Case Study: How Nordstrom’s Tire Return Became a Branding Legend with Limits Read More »

case study coca cola new coke

Case Study: Coca‑Cola and the Launch of New Coke – A Branding Misstep That Sparked a Consumer Revolt

Reading Time: 3 minutes

Brief Summary

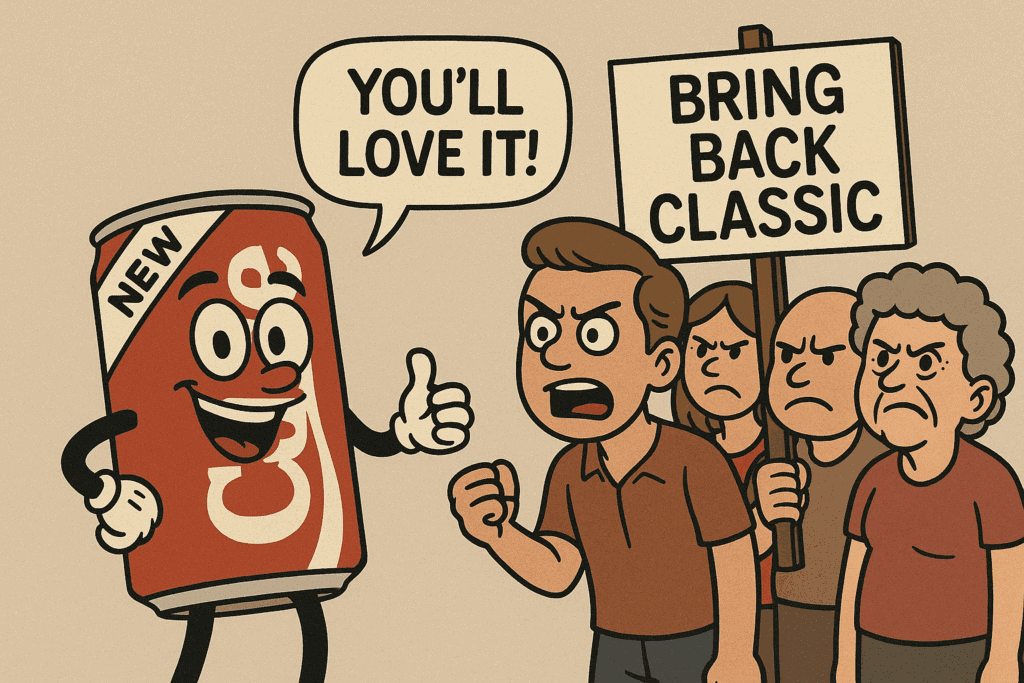
Coca Cola New Coke Case Study

In April 1985 Coca‑Cola replaced its original formula with a sweeter version known as New Coke. The change aimed to regain market share from Pepsi, which had been gaining ground in blind taste tests and consumer preference.

Although the new formula initially tested well, the public reaction was overwhelmingly negative. After just 79 days, Coca‑Cola brought back the original recipe as Coca‑Cola Classic.

This incident is now widely cited as one of the most significant lessons in brand loyalty and the emotional attachment consumers have to legacy products.

Company Involved

The Coca‑Cola Company

Marketing Topic

Product Positioning, Brand Identity, Crisis Response, Consumer Experience

Public Reaction or Consequences

The backlash was immediate and intense. Coca‑Cola’s customer hotline received over 1,500 calls per day, up from 400. Protest groups formed, including the Old Cola Drinkers of America. Letters were addressed to executives with names like “Chief Dodo.” Media outlets and comedians mocked the decision. Even Fidel Castro publicly criticized the move, framing it as a sign of American capitalist decline.

Why It Matters Today

This case underscores how emotional branding can override product logic. It teaches marketers that data from tests and surveys must be weighed against cultural and emotional resonance. In an era where brand decisions are amplified by social media, the lessons from New Coke are more relevant than ever.

3 Takeaways

  1. Consumer emotions matter more than product features. Functional improvements may backfire if they disrupt brand identity.
  2. Test results do not equal market readiness. Blind taste tests showed preference for New Coke, but failed to capture the emotional importance of the original formula.
  3. Own your mistakes and respond quickly. Coca‑Cola’s swift reintroduction of the original formula helped recover its reputation and regain consumer trust.

Notable Quotes and Data

  • “The cola category in general was lethargic. Consumer preference for Coca‑Cola was dipping.” — Coca‑Cola executive, History.com
  • “By June 1985, the company hotline was getting 1,500 calls a day, compared with 400 a day before the taste change.” — History.com
  • “It was, Time declared, ‘like putting a miniskirt on the refurbished Statue of Liberty.'” — Time Magazine

Full Case Narrative

In the early 1980s Coca‑Cola was losing market share to Pepsi, particularly among younger consumers. Pepsi’s advertising campaigns, including the Pepsi Challenge, showcased how people preferred its sweeter formula in blind taste tests. Coca‑Cola launched Project Kansas, a secret initiative to develop a new, sweeter formula to compete directly.

On April 23, 1985, New Coke was introduced. The announcement was backed by taste tests showing that consumers preferred the new formula. Sales initially rose, but emotional backlash quickly followed. Consumers felt betrayed, viewing the change as an attack on tradition. Protest campaigns, media mockery, and fan outrage spread quickly.

Just 79 days later, Coca‑Cola announced the return of the original formula, now branded as Coca‑Cola Classic. The public welcomed it with enthusiasm, and sales rebounded. While New Coke remained on the market for years under the name Coke II, it never achieved significant success again.

The case remains a classic lesson on understanding customer sentiment, brand equity, and how not to ignore the voice of the consumer in pursuit of innovation.

Timeline

  • April 23, 1985: Coca‑Cola launches New Coke nationwide.
  • May 1985: Consumer backlash escalates. Hotline calls spike to over 1,500 per day.
  • June 1985: Protest groups form and public ridicule increases. Editorials, late-night jokes, and political commentary amplify criticism.
  • July 11, 1985: Coca‑Cola announces the return of the original formula, rebranded as Coca‑Cola Classic.

What Happened Next?

After the reintroduction of Coca‑Cola Classic, public perception of the brand improved. The company leaned into nostalgia with patriotism-themed ads and celebrity endorsements. New Coke remained on shelves as Coke II until it was quietly discontinued in 2002. Marketers today continue to study this case as an example of how product changes must consider not just performance, but identity, history, and emotional resonance.

One Sentence Takeaway

Even the most researched product launch can fail if it disconnects from the emotional core of your brand.

Sources and Citations

History.com, New Coke debuts, one of the biggest product flops in history, published April 23, 2024.

Encyclopedia Britannica, New Coke overview, accessed June 2025.

The Coca‑Cola Company, New Coke: The most memorable marketing blunder ever?, company history page.

Allrecipes, Coke Classic: The Story of How America Saved Its Favorite Drink, published June 2025.

Time Magazine, Here’s What New Coke Tasted Like, published April 23, 2015.

Food and Wine, We compared New Coke to Coca‑Cola – Here are our thoughts, published June 2019.

Case Study: Coca‑Cola and the Launch of New Coke – A Branding Misstep That Sparked a Consumer Revolt Read More »

pero media type model 2

The Evolution of Marketing Media: Why the PERO Model is the Future

Reading Time: 4 minutes

Marketing has always been about getting the right message to the right audience at the right time, but as the landscape evolves, the way we think about marketing media has shifted. Traditional models like Paid, Earned, and Owned (PEO) helped marketers streamline their strategies. However, as social media platforms and digital ecosystems have grown in influence, there’s now a need for a more comprehensive model. Enter the PERO model: Paid, Earned, Rented, and Owned media.

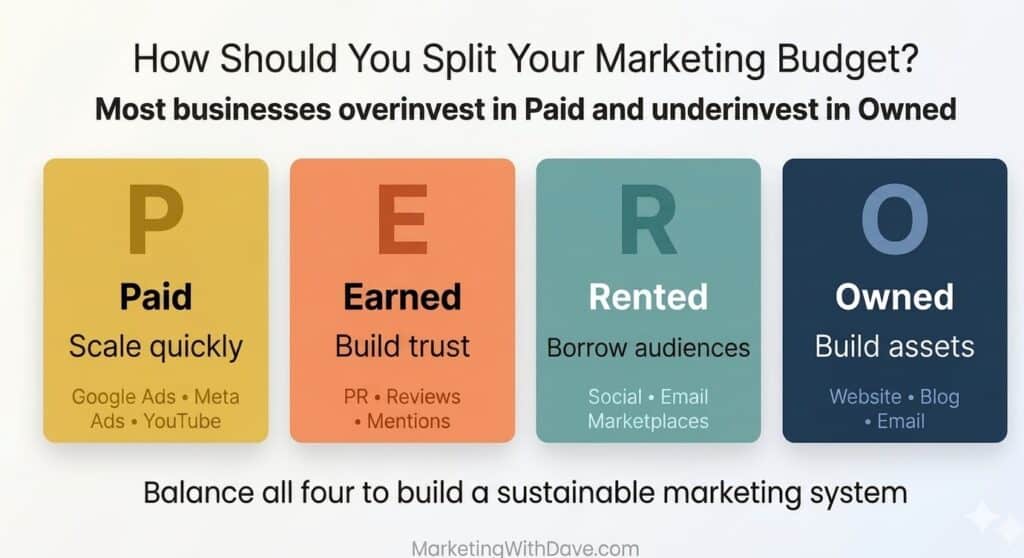
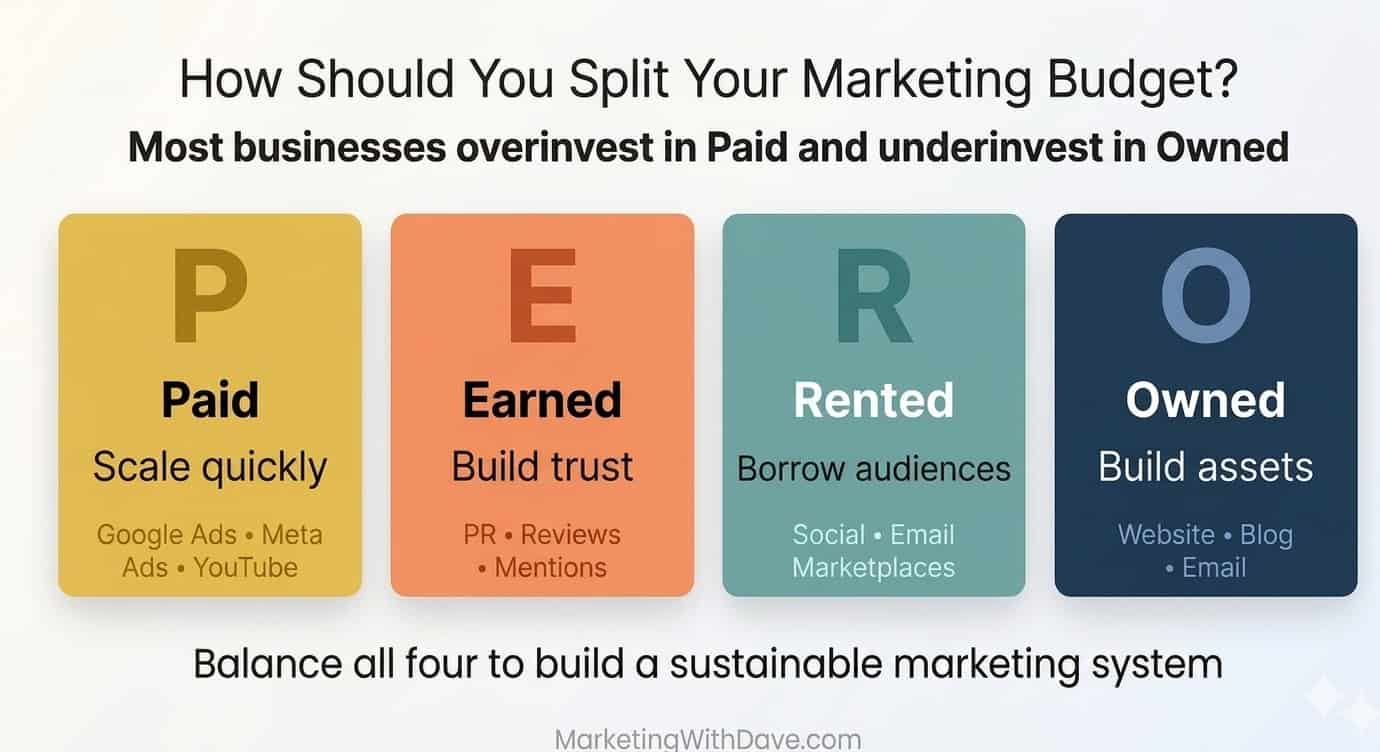
PERO Marketing Media Type Model.

The History of Marketing Media Types

Marketing strategies have long relied on clear distinctions between different types of media. Historically, the Paid, Earned, and Owned model (PEO) served as the backbone for marketers’ media allocation strategies:

  • Paid Media: This includes all forms of advertising that require a budget, such as Google Ads, social media ads, and influencer marketing.
  • Earned Media: Media coverage you earn through organic PR, media mentions, and social media shares. It’s the most credible type of media because it’s not directly controlled by the brand.
  • Owned Media: Content and platforms that you fully control, such as your website, blog, and social media profiles.

As digital and social media platforms grew in prominence, the PESO model (Paid, Earned, Shared, Owned) was introduced by Gini Dietrich to better account for the growing importance of Shared Media, content generated by users and amplified through social interactions. PESO captured how brands should leverage these types of media:

  • Paid Media: Paid advertising, such as Google Ads or social media ads.
  • Earned Media: Media coverage earned through PR, mentions, and organic social shares.
  • Shared Media: Content shared through social media, including organic shares and user-generated content.
  • Owned Media: Content that brands fully control, such as websites and email lists.

PERO takes the PESO framework a step further by adding Rented Media as a distinct category. As social media and digital platforms have grown, brands increasingly rely on these third-party platforms where they ‘rent’ access to large, engaged audiences, making Rented Media a crucial part of modern marketing strategies.

This led to the development of the PERO model, which introduces Rented Media as a distinct category to reflect the increasing reliance on third-party platforms.

  • Paid Media remains the same.
  • Earned Media continues to reflect organic PR and social mentions.
  • Owned Media still refers to what the brand controls.
  • Rented Media was introduced to account for the increasing reliance on third-party platforms where brands rent access to large, engaged audiences without owning the platform. These platforms, such as Facebook, Instagram, and TikTok, allow you to engage with audiences but you don’t control the platform or its data.

The PERO model helps marketers understand the full scope of modern marketing media, balancing long-term investments in Owned media with the more immediate, but sometimes volatile, benefits of Rented media.

Why the PERO Model is a Better Approach

The PERO model offers a comprehensive view of modern marketing media for the following reasons:

  • Inclusivity of Rented Media: With social media platforms, websites, and other third-party services, businesses rent access to vast, engaged audiences. By distinguishing Rented media from Paid and Earned assets, the PERO model helps marketers understand how to strategically use these platforms without becoming overly dependent on them.
  • Balanced Resource Allocation: The model encourages a balanced approach to media allocation. Paid media gives you immediate results, while Earned media builds credibility and Owned media nurtures long-term customer relationships. Rented media serves as a short-term solution to expand your reach.
  • Clarity in Strategy: By separating Rented media from the rest, marketers can treat it as a tool for reaching specific audiences, understanding that it can change or disappear (platform shutdowns or policy changes), unlike owned assets.

Suggested Media Allocation: 40/30/20/10 Breakdown

A common approach to allocating your marketing budget across Paid, Earned, Rented, and Owned media is the following 40/30/20/10 breakdown. This is a starting point and should be adjusted based on your experience, goals, business size, and industry.

Below is a quick reference table that breaks down the most common types of media within the PERO model: Paid, Earned, Rented, and Owned. This will help you understand how different marketing activities fall into each media category, enabling you to better allocate your marketing resources.

PaidEarnedRentedOwned
Google/Bing AdsMedia MentionsFacebook, Instagram, TikTok, YouTube, X (Twitter)Website
Social Media AdsOrganic Social SharesOnline Communities (Facebook Groups, LinkedIn Groups, Reddit)Blog
Display AdsPublic Relations (PR)Influencer Partnerships (on rented platforms)Email List
Sponsored ContentInfluencer MentionsOrganic Social Media Posts (not paid for)Customer Databases
Affiliate MarketingUser ReviewsDisplay Ads on Third-Party SitesMobile App
Remarketing AdsWord-of-MouthSocial Media Engagement (Likes, Shares, Comments on Platforms)Content Libraries
  • 40% Owned Media: Long-term assets like your website, blog, and email list that are crucial for building brand loyalty.
  • 30% Paid Media: Immediate results and conversions through paid ads across platforms like Google and social media.
  • 20% Earned Media: PR, influencer mentions, and organic social media to build credibility and trust.
  • 10% Rented Media: Platforms like Facebook, Instagram, and TikTok offer short-term reach, but remember that control can change.

B2B vs. B2C: Tailoring the Model for Your Business

B2B and B2C companies may adjust these percentages based on their specific goals:

  • B2B: Owned Media (like white papers, case studies, and professional blogs) may take up a larger portion of the budget, while Paid Media may focus on LinkedIn Ads and other professional networks.
  • B2C: Paid Media plays a more significant role, with a higher allocation to ads on platforms like Facebook, Instagram, and Google to drive direct sales.

Flexibility is Key

The PERO model is a flexible framework that can be adjusted based on business size, goals, and market conditions. Continuous testing and optimization of media allocation will allow you to fine-tune your strategy over time.

The Evolution of Marketing Media: Why the PERO Model is the Future Read More »

the next cmo

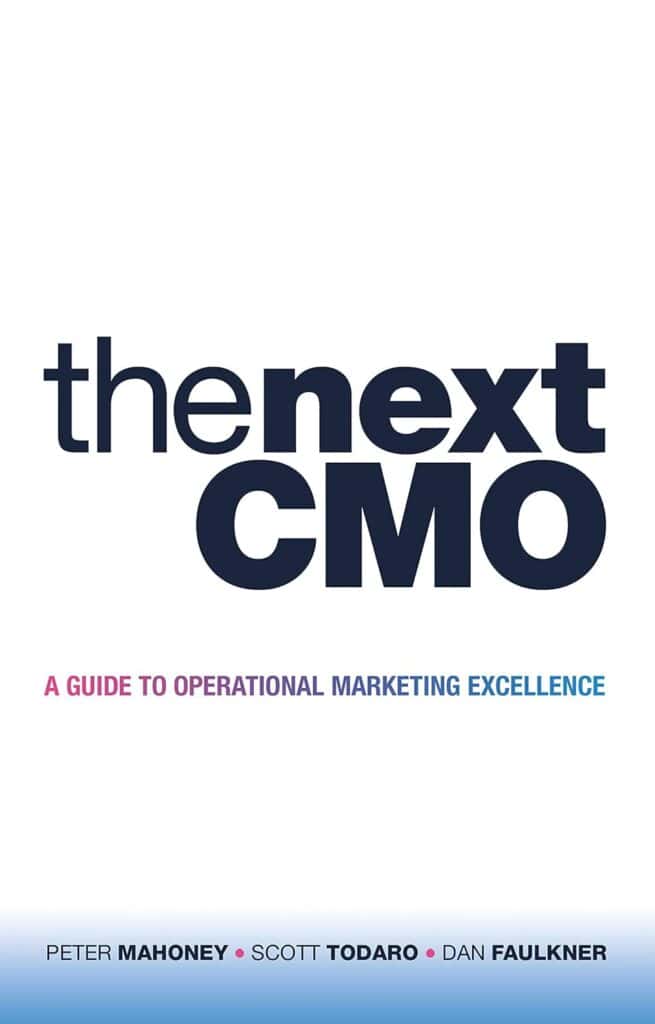
The Next CMO by Peter Mahoney Book Summary

Reading Time: 2 minutes

Top Three Quotes

  • “The problem with marketing isn’t the marketers—it’s that the tools used to manage the marketing function have not caught up with the incredible change that the function has seen.”
  • “Execution is the single biggest weakness in marketing planning.”
  • “Campaign managers used to exist in marketing teams… the role has been sidelined, but we believe it’s time for marketing campaign management to make a comeback.”

Book Theme

The Next CMO book is a guide to mastering operational marketing excellence—helping CMOs and marketing teams execute smarter and align every action to business outcomes.

Why You Should Read This Book

  • To improve your ability to lead marketing through planning, budgeting, and communication.
  • To benchmark your team’s operational effectiveness using the Operational Marketing Index.
  • To turn strategy into action with frameworks and templates that are immediately usable.

Key Ideas and Arguments Presented

  1. CMOs fail more from execution gaps than bad strategy.
  2. Operational discipline is a differentiator in high-performing teams.
  3. Budget mismanagement leads to chronic underspend.
  4. Goals-based planning aligns marketing with business value.
  5. Campaign managers are key to cross-functional success and strategic execution.
  6. Teams must embrace agile planning in a volatile landscape.
  7. Use marketing ROI to tell a whole-plan story, not just the highlights.
  8. A strong culture of operational excellence encourages truth-seeking, not cherry-picking.

Book Outline

  • 1. The Problem with Operational Marketing Leadership
  • 2. The Impact of Ineffective Marketing Execution
  • 3. Elements of Operational Marketing Excellence
  • 4. Marketing DNA: Stakeholders and Culture
  • 5. Building a Winning Marketing Plan
  • 6. Goals-Based Marketing
  • 7. Strategy Development
  • 8. Redefining Campaigns
  • 9. Managing the Budget
  • 10. The New ROI
  • 11. Reporting to the Board
  • 12. The Operational Marketing Index

Key Takeaways

  • Execution is the missing link in most marketing failures.
  • Planning must be connected to strategy, budget, and goals.
  • Operational frameworks drive better agility and clarity.

Key Techniques

  • Marketing Plan Framework (MPF)
  • Goals Pyramid
  • Operational Marketing Index
  • ROI Storytelling via RoMP
  • Campaign Execution Template

Author’s Qualifications

Mahoney, Todaro, and Faulkner bring 70+ years of combined experience in marketing, tech, and executive leadership, including founding Plannuh and leading at Nuance Communications.

Comparison to Similar Books

More operational than Seth Godin’s philosophy, more strategic than Donald Miller’s frameworks, and focused entirely on marketing unlike John Doerr’s general OKRs.

Target Audience

  • CMOs and aspiring marketing leaders
  • Marketing operations professionals
  • Startup founders handling marketing
  • Agencies wanting to up-level strategy
  • Marketing students and educators

Critical Response to the Book

The book’s first edition earned strong praise and adoption from the marketing community, prompting a deeper second edition filled with frameworks, benchmarks, and tools.

One Sentence Takeaway

Operational execution—not strategy alone—is what separates the next generation of successful CMOs.

The Next CMO by Peter Mahoney Book Summary Read More »

Optimized marketing segmentation infographic highlighting demographic, psychographic, geographic, behavioral, and benefit-based strategies for targeted audience engagement and effective brand messagin.

Marketing Segmentation Explained: Frameworks, Examples and How to Do It Right

Reading Time: 8 minutes

Market segmentation is the practice of dividing a broad market into smaller groups of consumers who share similar characteristics, needs, or behaviors. In other words, not all consumers are your customers – segmentation identifies those sub-markets where people are more likely to buy your product or service. By splitting a large “pie” (the total market) into meaningful slices, companies can design tailored products and messages for each group, rather than using one-size-fits-all marketing.

Why does this matter? A clear segmentation strategy makes marketing far more effective and efficient. Think of it like archery: hitting a bullseye requires focusing on the right spot. In marketing terms, segments let you aim your campaigns at the precise group most likely to respond, instead of scattering resources on everyone.

Optimized marketing segmentation infographic highlighting demographic, psychographic, geographic, behavioral, and benefit-based strategies for targeted audience engagement and effective brand messagin.

Some key benefits of good segmentation include:

  • More efficient spending: By concentrating on relevant customer segments, companies avoid wasting ad budget on disinterested audiences. Campaigns tailored to each segment tend to have higher response rates because the message directly addresses that group’s needs.
  • Stronger engagement and loyalty: Targeted marketing resonates more deeply. Research shows segmentation often leads to better customer experiences and loyalty because people feel understood. Instead of generic pitches, marketers can speak each segment’s “language” about the things they care about.
  • Higher profits: Industry studies back up these advantages. For example, a Bain & Company survey found 81% of executives said segmentation was crucial for profit growth, and companies with strong segmentation strategies enjoyed about 10% higher profits over five years.
  • Competitive edge: In a crowded marketplace, a well-segmented approach can be a differentiator. When customers see that a brand’s ads and products match their specific lifestyle or needs, they’re more likely to respond.

In summary, segmentation aligns marketing with customer reality. Rather than firing marketing messages at the whole “wall” of the market (where most arrows miss), segmentation focuses each “arrow” on the right cluster of consumers. This alignment drives better engagement, higher ROI, and business growth.

Major Segmentation Types

Marketers commonly segment markets using five broad bases. Each base slices the audience in a different way:

1. Demographic Segmentation

Groups consumers by objective attributes like age, gender, income, education, occupation, marital status, or family size. For example, a luxury car company might target the high-income professionals segment, while a toy manufacturer focuses on the families with young children segment. Demographics are easy to measure (everyone has an age or income), so it’s simple to gather data and analyze. However, demographic segments can be broad and may not capture why people buy – two people with the same age and income might have very different tastes.

2. Geographic Segmentation

Divides the market by location such as country, region, city, or climate. The idea is “people in different places have different tastes or needs,” so brands tailor products to local preferences. For instance, McDonald’s famously adjusts its menu by country – offering a McAloo Tikki (potato burger) in India and a Teriyaki Chicken Sandwich in Japan. Geographic segmentation is straightforward and can capture cultural or climate-driven differences, but it assumes homogeneity within regions. It may miss individual differences (not everyone in a region behaves alike) and can be too coarse if the product is global in nature.

3. Psychographic Segmentation

Splits consumers by lifestyle, values, attitudes, interests, or personality traits. It goes deeper than demographics by asking why people buy. For example, outdoor apparel brand Patagonia targets consumers who value environmental sustainability and adventure. Psychographic segments allow highly relevant messaging (“We share your eco-values”) and can explain motivations, but they are harder to measure and require qualitative research (surveys, interviews) to identify. Data on people’s beliefs or hobbies is not as readily available as demographic data, so psychographic segmentation often involves more investment.

4. Behavioral Segmentation

Categorizes consumers by their behaviors or interactions with the product/service. This includes purchase history, brand loyalty, usage rate, or purchase occasion. For example, e-commerce sites often retarget users who abandoned items in their shopping cart – that segment (users who added to cart but didn’t buy) is behaving differently and gets its own targeted ads. Behavioral segments are useful because they are directly tied to actions (you know someone’s already interested in a product). They allow precise targeting (e.g. frequent vs infrequent buyers), but require detailed data collection and analysis (not all businesses have easy access to such data). Also, behavior can change over time (someone may be a new buyer one month and a loyal customer the next), so segments may need frequent updating.

5. Benefit-Based Segmentation

Groups customers by the specific benefits or value they seek from the product. Here the focus is on what consumers want to achieve. For example, in the shampoo market, one segment may primarily seek anti-dandruff benefits while another cares about color-protection or hydration. Marketers identify these benefit segments by asking customers their needs or by observing usage patterns. Benefit segmentation directly ties to product development: each segment’s needs can shape product features or messaging. The upside is highly relevant marketing (“Our toothpaste whitens your smile” vs. “Our toothpaste strengthens enamel”). The downside is that benefits can overlap and are harder to quantify; it usually takes market research to discover the distinct benefits consumers seek.

To summarize, each segmentation base offers a different lens. In practice, companies often use combinations (for example, demographic + psychographic) to create more refined segments. The key is that each chosen segment should be internally similar and distinct from other segments.

Comparing Segmentation Types

The comparison below examines the common segmentation bases, with examples and typical pros/cons for each:

Demographic Segmentation

Focus/Example: Group by attributes (age, income, gender, etc.). Example: Luxury cars for high-income professionals.

Pros: Easy to measure (census, surveys). Broad data availability. Simple to implement.

Cons: May overlook attitudes or needs. Broad segments; low insight into motivations.

Geographic Segmentation

Focus/Example: Group by location (country, climate, region). Example: McDonald’s adapting menus to local tastes (India vs. Japan).

Pros: Captures regional/cultural preferences. Useful for physical distribution or local laws.

Cons: Assumes uniformity within regions. May ignore individual differences across regions.

Psychographic Segmentation

Focus/Example: Group by lifestyle and values. Example: Patagonia appeals to eco-conscious outdoor enthusiasts.

Pros: Deep insights into customer motivations. Enables highly tailored emotional messaging.

Cons: Harder and costlier to research and quantify. Requires surveys or interviews to gather data.

Behavioral Segmentation

Focus/Example: Group by user actions or usage patterns. Example: Online shoppers retargeted after cart abandonment.

Pros: Directly tied to actual purchase behavior. Can target based on loyalty, occasion, usage.

Cons: Data-intensive: needs tracking systems. Behavior can shift over time (requires updates).

Benefit-Based Segmentation

Focus/Example: Group by benefits sought from product. Example: Shampoo buyers segment by desire for volume vs. for color-protection.

Pros: Focuses on why customers buy, guiding product design. Creates clear value propositions.

Cons: Segments can overlap (someone wants multiple benefits). Hard to identify without customer research.

Each approach can be powerful when applied to the right product. Demographic and geographic segments are relatively easy to identify with existing data, making them common first steps. Psychographic and behavioral segments typically yield richer targeting but need more effort to develop. Benefit segmentation is especially useful for product strategy, as it directly links marketing to customer needs.

Segmentation Frameworks and Criteria

To create effective segments, marketers follow structured frameworks. A classic guideline is that each segment should satisfy five criteria: it must be Accessible, Differentiable, Actionable, Measurable, and Substantial. In practice, this means:

  • Accessible: The company must be able to reach and serve the segment through communication or distribution channels. Can the marketing team affordably contact these customers?
  • Differentiable: The segment should be clearly distinct in its response or needs. In other words, customers within a segment should be similar to each other but meaningfully different from other segments. This ensures one marketing program won’t blur into another.
  • Actionable: The segment can be targeted with a practical marketing strategy. It should be possible to design specific promotions or products for this segment and expect measurable outcomes.
  • Measurable: The segment’s size and purchasing power can be estimated quantitatively. For example, we should be able to approximate “there are 10,000 people in this segment in our market and they spend $X.” This determines if it’s worth pursuing.
  • Substantial: The segment is large enough and profitable enough to justify the resources. It should represent a meaningful share of the market (not just a handful of niche consumers).

Together these criteria (sometimes abbreviated ADMAS) help filter out impractical segmentation schemes. If a proposed segment is too small, too hard to measure, or unreachable, it likely won’t support a viable marketing program.

Segmentation Models and Tools

Beyond these criteria, there are formal models to guide segmentation. For psychographic segmentation, the VALS framework (Values and Lifestyles) is a well-known system that classifies U.S. consumers into lifestyle types. For B2B markets, firmographic segmentation (by company size, industry, etc.) plays the role that demographics play in consumer markets.

Data-driven methods are also common: for example, cluster analysis (e.g. K-means clustering) can uncover natural segments from customer data. E-commerce firms often use RFM analysis (segmenting by recency, frequency, monetary value of purchases).

Ultimately, these frameworks ensure segments are grounded in real differences. Industry best practices emphasize that segments must be actionable and meaningful. By following segmentation models and checking against standard criteria, marketers increase the chances of finding the right segments – those they can actually target effectively.

Explaining Segmentation with Metaphors

For beginners, it helps to use visual metaphors to grasp segmentation:

  • Slicing a pie or cake: Imagine the whole market as a giant pie. Segmentation means cutting the pie into slices by different flavors or ingredients. Each slice goes to a group that “likes” that flavor. This way, you serve each person a piece they want, rather than giving everyone the same combination.
  • Sorting fruit into baskets: Think of a mix of apples, oranges, and bananas. If you market fruit snacks, you wouldn’t treat all fruit lovers the same. You might sort by type – put apples in one basket (segment), oranges in another. Then you can tailor messages (“Our snack has the sweet crunch you crave” for apple lovers vs “Our tropical citrus bites” for orange lovers).
  • Inviting the right guests to a party: Segmentation is like curating your guest list. You don’t invite everyone in town—you invite those whose tastes match the meal and the conversation. Marketing works the same way: curate your audience.
  • Hitting the bullseye: Rather than randomly firing arrows, segmentation helps you aim accurately at the right target audience. Each arrow (ad) hits closer to the bullseye (ideal customer) because you’ve narrowed down the aim.

These metaphors illustrate the core idea: don’t try to please the entire market at once. Instead, break it into groups (slices, baskets, guest lists, targets) and tailor your approach so that each group’s specific tastes and needs are met. This visual thinking makes it clear why segmentation prevents wasted effort and enhances resonance with customers.

How to Start Segmenting Your Audience

To put segmentation into practice, marketers can follow a step-by-step process:

  1. Define the overall market: Identify your total addressable market and ensure there is enough need for your offering. Ask: Is this market large enough? What core problem are you solving?
  2. Choose segmentation variables: Decide which bases (demographic, geographic, psychographic, behavioral, benefit) are relevant to your business. Often, a combination works best. For example, a company might segment by both age group and by purchase occasion. Experiment with different criteria to find meaningful groups.
  3. Gather and research data: Collect data to profile customers on those variables. This might involve analyzing sales records, website analytics, or customer surveys. Use both quantitative data (e.g. purchase history, survey ratings) and qualitative insights (e.g. focus groups, interviews). Ask customers about their preferences, needs, and lifestyle to uncover patterns.
  4. Analyze to form segments: Use the data to identify clusters of customers who share characteristics. Statistical methods (like cluster analysis) can help, but even cross-tabulating key variables may reveal segments. For each potential segment, check the criteria from above (measurable, substantial, etc.). Create clear segment profiles (e.g. “Tech-savvy urban millennials who shop online weekly”).
  5. Test and refine: Develop tailored marketing messages or small campaigns for each segment and measure the response. For example, send a targeted email offer to one segment and compare its conversion rate to that of a general campaign. Use A/B testing or pilot launches. If a segment doesn’t respond as expected, revisit your data or consider splitting it into sub-segments. Continuously refine the segmentation: markets change, so update segments periodically.

By following these steps – defining the market, selecting bases, researching customers, creating segments, and testing – marketers can build actionable segments. Over time, this process will inform product development, channel strategy, and messaging for each group. It’s a cyclical strategy: revisit your segments when market conditions shift (for instance, after a big trend or annually).

Actionable Advice:

Start small. You might begin with one or two key variables that you suspect are important for your business (e.g. age and buying frequency). Use your existing data or conduct a quick survey. Even informal segmentation (like grouping customers by their main complaint or favorite feature) can yield insights. The goal is to move from “everyone” to “these two or three groups” as the focus of your next campaign. Then learn and expand from there.

In Summary

Marketing segmentation is about recognizing that not all consumers are the same. By dividing your market into well-defined groups (based on demographics, location, lifestyle, behavior, or sought benefits) and applying disciplined frameworks to create effective segments, you enable highly targeted, efficient marketing. Proper segmentation drives better customer engagement, higher ROI, and ultimately stronger business results.

Marketing Segmentation Explained: Frameworks, Examples and How to Do It Right Read More »

market segmentation analysis

Market Segmentation Analysis by Sara Dolnicar Book Summary

Reading Time: 2 minutes

Top Three Quotes

Version 1.0.0
  • “Segmentation is not always the answer. It is only useful when it adds value.”
  • “No algorithm can compensate for poor data quality or ill-defined segmentation goals.”
  • “Market segmentation is not just a statistical exercise — it is a strategic decision-making process.”

Book Theme

Marketing Segmentation Analysis covers how to understand, perform, and apply market segmentation using both managerial and statistical perspectives — with an emphasis on replicable analysis using R.

Why You Should Read This Book

  • Bridges the gap between marketing strategy and data science.
  • Offers a replicable 10-step framework.
  • Includes real-world datasets and R code.
  • Improves targeting, resource allocation, and customer satisfaction.
  • Perfect for cross-functional marketing teams.

Key Ideas or Arguments

  1. Segmentation adds strategic clarity.
  2. 10-step framework covers the full lifecycle.
  3. Uses relatable tourism examples.
  4. Combines theory with execution.
  5. Emphasizes data-driven approaches.
  6. Stresses the importance of good data.
  7. Powered by R for transparency.
  8. Segmentation isn’t always necessary.
  9. Visual communication is crucial.
  10. Segments must evolve over time.

Book Outline

  • Part I: Introduction
    • Market Segmentation
    • Market Segmentation Analysis
  • Part II: 10 Steps (from deciding to segment to evaluating results)
    • Step 1: Deciding (not) to Segment
    • Step 2: Specifying the Ideal Target Segment
    • Step 3: Collecting Data
    • Step 4: Exploring Data
    • Step 5: Extracting Segments
    • Step 6: Profiling Segments
    • Step 7: Describing Segments
    • Step 8: Selecting the Target Segment(s)
    • Step 9: Customizing the Marketing Mix
    • Step 10: Evaluating and Monitoring
  • Appendices: Case Studies, R, Datasets

Key Takeaways

  • 10-step segmentation framework
  • Distance-based & model-based clustering
  • Biclustering & stability diagnostics
  • Data visualization techniques
  • R packages: MSA, flexclust, flexmix, mclust

Author’s Qualifications

  • Sara Dolnicar (University of Queensland)
  • Bettina Grün (Johannes Kepler University Linz)
  • Friedrich Leisch (University of Natural Resources and Life Sciences, Vienna)

Comparison to Similar Books

More replicable and statistically grounded than traditional marketing texts. Uniquely open-source and application-focused.

Target Audience Groups

  • Marketing analysts and data scientists
  • Strategists and CMOs
  • Academics and students
  • Tourism professionals
  • Market researchers and R users

Critical Response to Book

Praised for making segmentation transparent and practical. Adopted widely in education and professional settings.

One Sentence Takeaway

Market segmentation only delivers value when it’s purposefully designed, properly executed, and continuously refined to inform better marketing decisions.

Market Segmentation Analysis by Sara Dolnicar Book Summary Read More »