Strategy

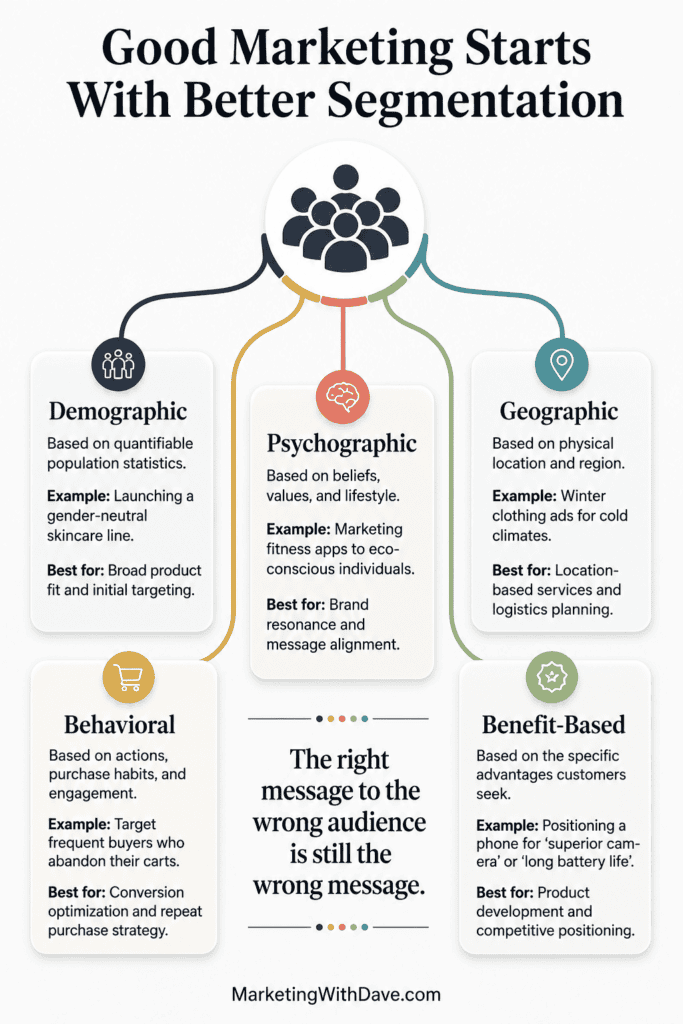
Optimized marketing segmentation infographic highlighting demographic, psychographic, geographic, behavioral, and benefit-based strategies for targeted audience engagement and effective brand messagin.

Marketing Segmentation Explained: Frameworks, Examples and How to Do It Right

Reading Time: 8 minutes

Market segmentation is the practice of dividing a broad market into smaller groups of consumers who share similar characteristics, needs, or behaviors. In other words, not all consumers are your customers – segmentation identifies those sub-markets where people are more likely to buy your product or service. By splitting a large “pie” (the total market) into meaningful slices, companies can design tailored products and messages for each group, rather than using one-size-fits-all marketing.

Why does this matter? A clear segmentation strategy makes marketing far more effective and efficient. Think of it like archery: hitting a bullseye requires focusing on the right spot. In marketing terms, segments let you aim your campaigns at the precise group most likely to respond, instead of scattering resources on everyone.
Optimized marketing segmentation infographic highlighting demographic, psychographic, geographic, behavioral, and benefit-based strategies for targeted audience engagement and effective brand messagin.

Some key benefits of good segmentation include:

  • More efficient spending: By concentrating on relevant customer segments, companies avoid wasting ad budget on disinterested audiences. Campaigns tailored to each segment tend to have higher response rates because the message directly addresses that group’s needs.
  • Stronger engagement and loyalty: Targeted marketing resonates more deeply. Research shows segmentation often leads to better customer experiences and loyalty because people feel understood. Instead of generic pitches, marketers can speak each segment’s “language” about the things they care about.
  • Higher profits: Industry studies back up these advantages. For example, a Bain & Company survey found 81% of executives said segmentation was crucial for profit growth, and companies with strong segmentation strategies enjoyed about 10% higher profits over five years.
  • Competitive edge: In a crowded marketplace, a well-segmented approach can be a differentiator. When customers see that a brand’s ads and products match their specific lifestyle or needs, they’re more likely to respond.

In summary, segmentation aligns marketing with customer reality. Rather than firing marketing messages at the whole “wall” of the market (where most arrows miss), segmentation focuses each “arrow” on the right cluster of consumers. This alignment drives better engagement, higher ROI, and business growth.

Major Segmentation Types

Marketers commonly segment markets using five broad bases. Each base slices the audience in a different way:

1. Demographic Segmentation

Groups consumers by objective attributes like age, gender, income, education, occupation, marital status, or family size. For example, a luxury car company might target the high-income professionals segment, while a toy manufacturer focuses on the families with young children segment. Demographics are easy to measure (everyone has an age or income), so it’s simple to gather data and analyze. However, demographic segments can be broad and may not capture why people buy – two people with the same age and income might have very different tastes.

2. Geographic Segmentation

Divides the market by location such as country, region, city, or climate. The idea is “people in different places have different tastes or needs,” so brands tailor products to local preferences. For instance, McDonald’s famously adjusts its menu by country – offering a McAloo Tikki (potato burger) in India and a Teriyaki Chicken Sandwich in Japan. Geographic segmentation is straightforward and can capture cultural or climate-driven differences, but it assumes homogeneity within regions. It may miss individual differences (not everyone in a region behaves alike) and can be too coarse if the product is global in nature.

3. Psychographic Segmentation

Splits consumers by lifestyle, values, attitudes, interests, or personality traits. It goes deeper than demographics by asking why people buy. For example, outdoor apparel brand Patagonia targets consumers who value environmental sustainability and adventure. Psychographic segments allow highly relevant messaging (“We share your eco-values”) and can explain motivations, but they are harder to measure and require qualitative research (surveys, interviews) to identify. Data on people’s beliefs or hobbies is not as readily available as demographic data, so psychographic segmentation often involves more investment.

4. Behavioral Segmentation

Categorizes consumers by their behaviors or interactions with the product/service. This includes purchase history, brand loyalty, usage rate, or purchase occasion. For example, e-commerce sites often retarget users who abandoned items in their shopping cart – that segment (users who added to cart but didn’t buy) is behaving differently and gets its own targeted ads. Behavioral segments are useful because they are directly tied to actions (you know someone’s already interested in a product). They allow precise targeting (e.g. frequent vs infrequent buyers), but require detailed data collection and analysis (not all businesses have easy access to such data). Also, behavior can change over time (someone may be a new buyer one month and a loyal customer the next), so segments may need frequent updating.

5. Benefit-Based Segmentation

Groups customers by the specific benefits or value they seek from the product. Here the focus is on what consumers want to achieve. For example, in the shampoo market, one segment may primarily seek anti-dandruff benefits while another cares about color-protection or hydration. Marketers identify these benefit segments by asking customers their needs or by observing usage patterns. Benefit segmentation directly ties to product development: each segment’s needs can shape product features or messaging. The upside is highly relevant marketing (“Our toothpaste whitens your smile” vs. “Our toothpaste strengthens enamel”). The downside is that benefits can overlap and are harder to quantify; it usually takes market research to discover the distinct benefits consumers seek.

To summarize, each segmentation base offers a different lens. In practice, companies often use combinations (for example, demographic + psychographic) to create more refined segments. The key is that each chosen segment should be internally similar and distinct from other segments.

Comparing Segmentation Types

The comparison below examines the common segmentation bases, with examples and typical pros/cons for each:

Demographic Segmentation

Focus/Example: Group by attributes (age, income, gender, etc.). Example: Luxury cars for high-income professionals.

Pros: Easy to measure (census, surveys). Broad data availability. Simple to implement.

Cons: May overlook attitudes or needs. Broad segments; low insight into motivations.

Geographic Segmentation

Focus/Example: Group by location (country, climate, region). Example: McDonald’s adapting menus to local tastes (India vs. Japan).

Pros: Captures regional/cultural preferences. Useful for physical distribution or local laws.

Cons: Assumes uniformity within regions. May ignore individual differences across regions.

Psychographic Segmentation

Focus/Example: Group by lifestyle and values. Example: Patagonia appeals to eco-conscious outdoor enthusiasts.

Pros: Deep insights into customer motivations. Enables highly tailored emotional messaging.

Cons: Harder and costlier to research and quantify. Requires surveys or interviews to gather data.

Behavioral Segmentation

Focus/Example: Group by user actions or usage patterns. Example: Online shoppers retargeted after cart abandonment.

Pros: Directly tied to actual purchase behavior. Can target based on loyalty, occasion, usage.

Cons: Data-intensive: needs tracking systems. Behavior can shift over time (requires updates).

Benefit-Based Segmentation

Focus/Example: Group by benefits sought from product. Example: Shampoo buyers segment by desire for volume vs. for color-protection.

Pros: Focuses on why customers buy, guiding product design. Creates clear value propositions.

Cons: Segments can overlap (someone wants multiple benefits). Hard to identify without customer research.

Each approach can be powerful when applied to the right product. Demographic and geographic segments are relatively easy to identify with existing data, making them common first steps. Psychographic and behavioral segments typically yield richer targeting but need more effort to develop. Benefit segmentation is especially useful for product strategy, as it directly links marketing to customer needs.

Segmentation Frameworks and Criteria

To create effective segments, marketers follow structured frameworks. A classic guideline is that each segment should satisfy five criteria: it must be Accessible, Differentiable, Actionable, Measurable, and Substantial. In practice, this means:

  • Accessible: The company must be able to reach and serve the segment through communication or distribution channels. Can the marketing team affordably contact these customers?
  • Differentiable: The segment should be clearly distinct in its response or needs. In other words, customers within a segment should be similar to each other but meaningfully different from other segments. This ensures one marketing program won’t blur into another.
  • Actionable: The segment can be targeted with a practical marketing strategy. It should be possible to design specific promotions or products for this segment and expect measurable outcomes.
  • Measurable: The segment’s size and purchasing power can be estimated quantitatively. For example, we should be able to approximate “there are 10,000 people in this segment in our market and they spend $X.” This determines if it’s worth pursuing.
  • Substantial: The segment is large enough and profitable enough to justify the resources. It should represent a meaningful share of the market (not just a handful of niche consumers).

Together these criteria (sometimes abbreviated ADMAS) help filter out impractical segmentation schemes. If a proposed segment is too small, too hard to measure, or unreachable, it likely won’t support a viable marketing program.

Segmentation Models and Tools

Beyond these criteria, there are formal models to guide segmentation. For psychographic segmentation, the VALS framework (Values and Lifestyles) is a well-known system that classifies U.S. consumers into lifestyle types. For B2B markets, firmographic segmentation (by company size, industry, etc.) plays the role that demographics play in consumer markets.

Data-driven methods are also common: for example, cluster analysis (e.g. K-means clustering) can uncover natural segments from customer data. E-commerce firms often use RFM analysis (segmenting by recency, frequency, monetary value of purchases).

Ultimately, these frameworks ensure segments are grounded in real differences. Industry best practices emphasize that segments must be actionable and meaningful. By following segmentation models and checking against standard criteria, marketers increase the chances of finding the right segments – those they can actually target effectively.

Explaining Segmentation with Metaphors

For beginners, it helps to use visual metaphors to grasp segmentation:

  • Slicing a pie or cake: Imagine the whole market as a giant pie. Segmentation means cutting the pie into slices by different flavors or ingredients. Each slice goes to a group that “likes” that flavor. This way, you serve each person a piece they want, rather than giving everyone the same combination.
  • Sorting fruit into baskets: Think of a mix of apples, oranges, and bananas. If you market fruit snacks, you wouldn’t treat all fruit lovers the same. You might sort by type – put apples in one basket (segment), oranges in another. Then you can tailor messages (“Our snack has the sweet crunch you crave” for apple lovers vs “Our tropical citrus bites” for orange lovers).
  • Inviting the right guests to a party: Segmentation is like curating your guest list. You don’t invite everyone in town—you invite those whose tastes match the meal and the conversation. Marketing works the same way: curate your audience.
  • Hitting the bullseye: Rather than randomly firing arrows, segmentation helps you aim accurately at the right target audience. Each arrow (ad) hits closer to the bullseye (ideal customer) because you’ve narrowed down the aim.

These metaphors illustrate the core idea: don’t try to please the entire market at once. Instead, break it into groups (slices, baskets, guest lists, targets) and tailor your approach so that each group’s specific tastes and needs are met. This visual thinking makes it clear why segmentation prevents wasted effort and enhances resonance with customers.

How to Start Segmenting Your Audience

To put segmentation into practice, marketers can follow a step-by-step process:

  1. Define the overall market: Identify your total addressable market and ensure there is enough need for your offering. Ask: Is this market large enough? What core problem are you solving?
  2. Choose segmentation variables: Decide which bases (demographic, geographic, psychographic, behavioral, benefit) are relevant to your business. Often, a combination works best. For example, a company might segment by both age group and by purchase occasion. Experiment with different criteria to find meaningful groups.
  3. Gather and research data: Collect data to profile customers on those variables. This might involve analyzing sales records, website analytics, or customer surveys. Use both quantitative data (e.g. purchase history, survey ratings) and qualitative insights (e.g. focus groups, interviews). Ask customers about their preferences, needs, and lifestyle to uncover patterns.
  4. Analyze to form segments: Use the data to identify clusters of customers who share characteristics. Statistical methods (like cluster analysis) can help, but even cross-tabulating key variables may reveal segments. For each potential segment, check the criteria from above (measurable, substantial, etc.). Create clear segment profiles (e.g. “Tech-savvy urban millennials who shop online weekly”).
  5. Test and refine: Develop tailored marketing messages or small campaigns for each segment and measure the response. For example, send a targeted email offer to one segment and compare its conversion rate to that of a general campaign. Use A/B testing or pilot launches. If a segment doesn’t respond as expected, revisit your data or consider splitting it into sub-segments. Continuously refine the segmentation: markets change, so update segments periodically.

By following these steps – defining the market, selecting bases, researching customers, creating segments, and testing – marketers can build actionable segments. Over time, this process will inform product development, channel strategy, and messaging for each group. It’s a cyclical strategy: revisit your segments when market conditions shift (for instance, after a big trend or annually).

Actionable Advice:

Start small. You might begin with one or two key variables that you suspect are important for your business (e.g. age and buying frequency). Use your existing data or conduct a quick survey. Even informal segmentation (like grouping customers by their main complaint or favorite feature) can yield insights. The goal is to move from “everyone” to “these two or three groups” as the focus of your next campaign. Then learn and expand from there.

In Summary

Marketing segmentation is about recognizing that not all consumers are the same. By dividing your market into well-defined groups (based on demographics, location, lifestyle, behavior, or sought benefits) and applying disciplined frameworks to create effective segments, you enable highly targeted, efficient marketing. Proper segmentation drives better customer engagement, higher ROI, and ultimately stronger business results.

Marketing Segmentation Explained: Frameworks, Examples and How to Do It Right Read More »

market segmentation analysis

Market Segmentation Analysis by Sara Dolnicar Book Summary

Reading Time: 2 minutes

Top Three Quotes

Version 1.0.0
  • “Segmentation is not always the answer. It is only useful when it adds value.”
  • “No algorithm can compensate for poor data quality or ill-defined segmentation goals.”
  • “Market segmentation is not just a statistical exercise — it is a strategic decision-making process.”

Book Theme

Marketing Segmentation Analysis covers how to understand, perform, and apply market segmentation using both managerial and statistical perspectives — with an emphasis on replicable analysis using R.

Why You Should Read This Book

  • Bridges the gap between marketing strategy and data science.
  • Offers a replicable 10-step framework.
  • Includes real-world datasets and R code.
  • Improves targeting, resource allocation, and customer satisfaction.
  • Perfect for cross-functional marketing teams.

Key Ideas or Arguments

  1. Segmentation adds strategic clarity.
  2. 10-step framework covers the full lifecycle.
  3. Uses relatable tourism examples.
  4. Combines theory with execution.
  5. Emphasizes data-driven approaches.
  6. Stresses the importance of good data.
  7. Powered by R for transparency.
  8. Segmentation isn’t always necessary.
  9. Visual communication is crucial.
  10. Segments must evolve over time.

Book Outline

  • Part I: Introduction
    • Market Segmentation
    • Market Segmentation Analysis
  • Part II: 10 Steps (from deciding to segment to evaluating results)
    • Step 1: Deciding (not) to Segment
    • Step 2: Specifying the Ideal Target Segment
    • Step 3: Collecting Data
    • Step 4: Exploring Data
    • Step 5: Extracting Segments
    • Step 6: Profiling Segments
    • Step 7: Describing Segments
    • Step 8: Selecting the Target Segment(s)
    • Step 9: Customizing the Marketing Mix
    • Step 10: Evaluating and Monitoring
  • Appendices: Case Studies, R, Datasets

Key Takeaways

  • 10-step segmentation framework
  • Distance-based & model-based clustering
  • Biclustering & stability diagnostics
  • Data visualization techniques
  • R packages: MSA, flexclust, flexmix, mclust

Author’s Qualifications

  • Sara Dolnicar (University of Queensland)
  • Bettina Grün (Johannes Kepler University Linz)
  • Friedrich Leisch (University of Natural Resources and Life Sciences, Vienna)

Comparison to Similar Books

More replicable and statistically grounded than traditional marketing texts. Uniquely open-source and application-focused.

Target Audience Groups

  • Marketing analysts and data scientists
  • Strategists and CMOs
  • Academics and students
  • Tourism professionals
  • Market researchers and R users

Critical Response to Book

Praised for making segmentation transparent and practical. Adopted widely in education and professional settings.

One Sentence Takeaway

Market segmentation only delivers value when it’s purposefully designed, properly executed, and continuously refined to inform better marketing decisions.

Market Segmentation Analysis by Sara Dolnicar Book Summary Read More »

prizm premier a marketers guide to the 68 u s consumer segments

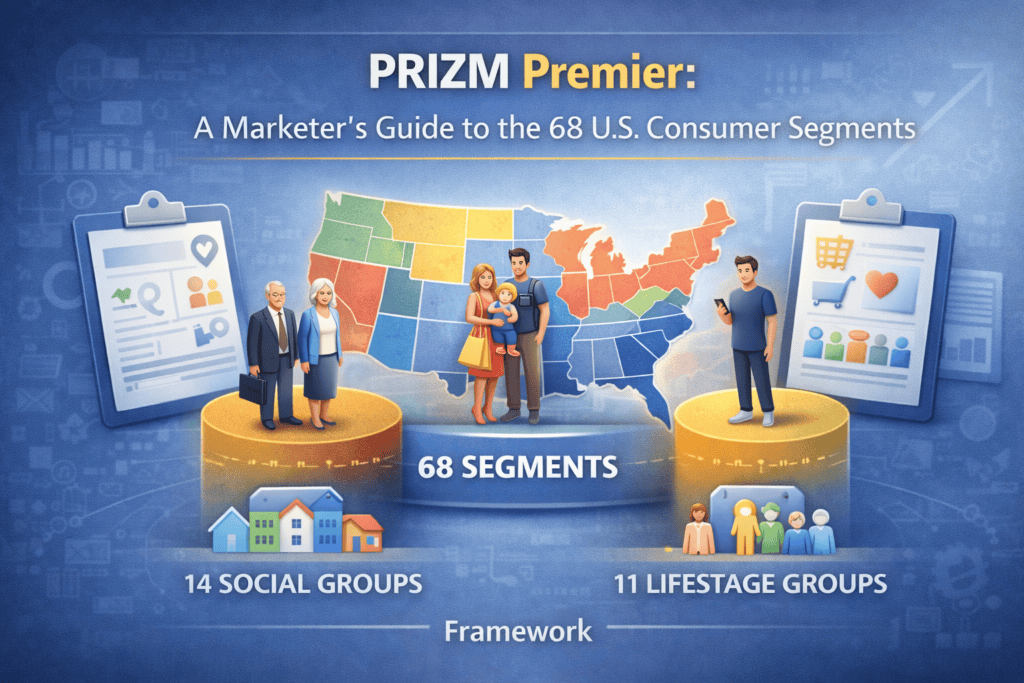
PRIZM Premier: A Marketer’s Guide to the 68 U.S. Consumer Segments

Reading Time: 3 minutes

PRIZM® Premier by Claritas is a powerful lifestyle segmentation tool that helps digital marketers understand and target audiences based on demographic, behavioral, and geographic data.

It classifies every U.S. household into one of 68 distinct segments, grouped into 14 Social Groups and 11 Lifestage Groups.

Why It Matters for Marketers

  • Improve audience targeting with lifestyle and geographic overlays.
  • Personalize messaging and creative to fit segment-specific preferences.
  • Refine media mix and channels using insights about digital behavior.
  • Optimize budget allocation based on segment performance.
  • Layer PRIZM on CRM data for segmentation, lookalike modeling, and retention.

PRIZM Social and Lifestage Groups

Social Groups (14)

Defined by urbanicity and affluence.

  1. Urban Uptown
  2. Midtown Mix
  3. Urban Cores
  4. Second City Society
  5. City Centers
  6. Metro Mix
  7. Connected Bohemia
  8. Comfortable Country
  9. Country Comfort
  10. Rural Resorts
  11. Rustic Living
  12. Simple Pleasures
  13. Middle America
  14. Small Town Charm

Lifestage Groups (11)

Defined by age, income, and presence of children.

  1. Youth & Transition
  2. Midlife Success
  3. Mature Years
  4. Young Achievers
  5. Young Families
  6. Midscale Families
  7. Family Life
  8. Active Adults
  9. Wealthy Empty Nests
  10. Midlife Stability
  11. Retirement Communities

Use the Claritas ZIP Code Look-Up tool to view the lifestage or social group for a given area, along with data on household income, composition, age distribution, and racial and ethnic demographics.

Full segment narratives are available here:
Claritas PRIZM® Premier Segment Narratives (PDF)

All 68 PRIZM Premier Segments

Segment CodeSegment NameQuick Description
01Upper CrustWealthy, retired, suburban couples
02Networked NeighborsWealthy, tech-savvy suburbanites
03Movers & ShakersWealthy, career-focused professionals
04Young DigeratiAffluent, urban tech-savvy singles
05Country SquiresUpper-middle-class families in rural areas
06Winner’s CircleSuccessful suburbanites with new money
07Money & BrainsHighly educated professionals in cities
08Gray PowerAffluent retirees in suburban areas
09Big Fish, Small PondSmall-town elites
10Fast-Track FamiliesUpscale, suburban, middle-aged families
11Blue Blood EstatesEstablished, wealthy suburban households
12Brite Lights, Li’l CityUrban, upper-middle-class singles & couples
13Upward BoundUpper-middle-class, suburban families
14Kids & Cul-de-SacsMiddle-class, child-centric suburbanites
15New Empty NestsEmpty nesters in upscale neighborhoods
16Park Bench SeniorsRetired, lower-middle-income households
17Urban AchieversYoung, lower-middle-class city dwellers
18Mayberry-villeSmall-town couples and retirees
19Milk & CookiesLower-middle-class suburban families
20Fast-Lane FamiliesYoung, affluent suburban families
21Urban EldersOlder, working-class urban singles
22Middleburg ManagersMiddle-income suburban families
23Greenbelt FamiliesChild-centered households in suburbs
24Up-and-ComersYoung, ambitious singles and couples
25Country CasualsRural, middle-income households
26The CosmopolitansUrban professionals and educated singles
27Big Sky FamiliesLarge families in remote communities
28Generation WebTech-focused, young urban households
29White Picket FencesSuburban, middle-class families
30Small-Town CollegiatesCollege students in small towns
31Connected BohemiansUrban, low-income creatives
32Downtown Melting PotLow-income urban multicultural households
33Second City StartupsYounger, budget-conscious city residents
34Young & RusticRural, lower-income singles
35Rural EscapeLower-income families in rural areas
36Toolbelt TraditionalistsWorking-class rural families
37Bright Lights, Li’l CityYoung singles in small urban hubs
38Hearth & HomeFamily-centric lower-middle suburbanites
39Urban Modern MixModern multicultural city dwellers
40Aspiring A-ListersYouthful, status-conscious households
41Rural BypassIsolated households in remote areas
42Metro MixMulticultural city residents
43Gray Collar ComfortWorking-class, older suburbanites
44Southwestern FamiliesHispanic families in the Southwest
45Urban FootstepsNewcomers to city life
46Low-Rise LivingRenters in mid-sized apartments
47Wireless UrbanitesTech-dependent urban dwellers
48Generation NationMulticultural millennial neighborhoods
49City StriversSingle renters in inner cities
50Metro GradsRecent grads in urban apartments
51Campuses & CafesStudents and recent grads in city hubs
52Full HouseLarger, diverse households
53Low Income EldersOlder, budget-restricted residents
54Striving SelfiesSocial and media-driven young adults
55Red, White & BluePatriotic, working-class suburbanites
56Multi-Culti MosaicDiverse, multilingual urban clusters
57Park Bench SeniorsOlder urban renters on fixed incomes
58Old MilltownsWorking-class factory town households
59New Melting PotRecent immigrants in urban areas
60Small Town Shallow PocketsFinancially-strapped rural households
61High-Rise RentersUrban, high-density rental units
62Modest Metro MeansLow-income city dwellers
63Low Income EldersSeniors with limited resources
64Family ThriftsBudget-minded suburban families
65Young City SolosYoung, urban professionals
66New BeginningsUrban newcomers, lower income
67Park Bench SeniorsOlder retirees on limited income
68Bedrock AmericaLower-income, small-town traditionalists

How to Use PRIZM Segments in Digital Marketing

1. Audience Targeting

Use segment characteristics to create interest-based ad targeting strategies across Meta, Google Ads, or programmatic platforms.

2. Content Personalization

Adapt tone, visuals, and value propositions based on the preferences and lifestyles of each segment.

3. Geographic Targeting

PRIZM is ZIP+4 based, making it ideal for local and hyperlocal marketing strategies.

4. CRM and Email Segmentation

Overlay your database with PRIZM to personalize lifecycle marketing and loyalty campaigns.

5. Campaign Optimization

Analyze performance by segment to optimize creative, media placement, and spend allocation.

Comparing PRIZM Premier with Other Segmentation Systems

Segmentation SystemFocusKey StrengthsBest Use Cases
PRIZM PremierDemographics, lifestyle, geography68 segments; ZIP+4 granularity; integrates with CRM dataDigital marketing, media planning, localized campaigns
VALS (Values and Lifestyles)Psychographics, motivations, valuesFocuses on psychological traits and consumer behaviorProduct development, brand positioning, messaging strategies
MosaicDemographics, household composition, behaviorsGlobal applicability; detailed household-level dataInternational marketing, cross-cultural segmentation
Demographic SegmentationAge, income, education, occupationSimple to implement; widely available dataBasic targeting, initial market analysis

PRIZM Premier: A Marketer’s Guide to the 68 U.S. Consumer Segments Read More »

navigating the customer journey a framework comparison guide

Navigating the Customer Journey: A Framework Comparison Guide

Reading Time: 2 minutes

Marketing is most effective when it’s aligned with how people make decisions. That’s where customer journey frameworks come in. These models provide structured ways to understand, design, and optimize interactions across the entire path a customer takes — from awareness to loyalty. In this post, we compare the most popular customer journey marketing frameworks: AIDA, See-Think-Do-Care (STDC), Flywheel, Buyer’s Journey, 5A, Messy Middle, and Feel-Think-Do-Care.

Why Compare Customer Journey Frameworks?

Different frameworks serve different purposes. Some are better for content planning, others for measurement or product messaging. Understanding the strengths and limitations of each helps marketers select the right model for their goals, channels, and audience behavior.

Overview of Frameworks

AIDA

  • Stages: Attention → Interest → Desire → Action
  • Origin: Elmo Lewis, 1898
  • Use Case: Traditional advertising, copywriting, sales funnels
  • Strength: Clear linear path with actionable focus
  • Limitation: Ignores post-purchase stages like loyalty and advocacy

See-Think-Do-Care (STDC)

  • Stages: See → Think → Do → Care
  • Origin: Avinash Kaushik
  • Use Case: Content marketing, digital strategy
  • Strength: Audience-first and intent-based
  • Limitation: Less emphasis on emotion or competitive influence

Flywheel

  • Stages: Attract → Engage → Delight (repeatable)
  • Origin: Popularized by HubSpot
  • Use Case: Inbound marketing, customer success
  • Strength: Focuses on momentum and customer retention
  • Limitation: Abstract without clear tactical stages

Buyer’s Journey

  • Stages: Awareness → Consideration → Decision
  • Origin: Common B2B framework
  • Use Case: Lead nurturing, sales alignment
  • Strength: Simple and intuitive
  • Limitation: Linear and assumes rational behavior

5A Model

  • Stages: Aware → Appeal → Ask → Act → Advocate
  • Origin: Kotler, Kartajaya, and Setiawan
  • Use Case: Modern omni-channel marketing
  • Strength: Incorporates social influence and loyalty
  • Limitation: Less commonly adopted, harder to operationalize

Messy Middle

  • Stages: Trigger → Explore ↔ Evaluate → Purchase
  • Origin: Google Research
  • Use Case: Search behavior, ecommerce, content
  • Strength: Reflects modern digital decision-making
  • Limitation: Harder to model in traditional funnels

Feel-Think-Do-Care

  • Stages: Feel → Think → Do → Care
  • Origin: Evolution of STDC
  • Use Case: Emotional branding, content strategy
  • Strength: Accounts for emotional triggers
  • Limitation: Less standardized, still emerging

Visual Comparison of Stages

  • AIDA: Attention → Interest → Desire → Action
  • STDC: See → Think → Do → Care
  • Flywheel: Attract → Engage → Delight → (repeat)
  • Buyer’s Journey: Awareness → Consideration → Decision
  • 5A Model: Aware → Appeal → Ask → Act → Advocate
  • Messy Middle: Trigger → Explore ↔ Evaluate → Purchase
  • Feel-Think-Do-Care: Feel → Think → Do → Care

Comparison Table

FrameworkOriginUse CaseStrengthWeaknessKey Metric(s)
AIDAElmo LewisAdvertising, SalesSimple and action-drivenStops at conversionConversion Rate
STDCAvinash KaushikContent, StrategyCustomer-first, intent-basedLacks emotional layerEngagement Rate
FlywheelHubSpotInbound, CXFocuses on retentionAbstract stagesCustomer Retention Rate
Buyer’s JourneyB2B MarketingLead nurturingWidely usedToo linearLead Conversion Rate
5AKotler et al.OmnichannelIncludes loyaltyLess knownAdvocacy Rate
Messy MiddleGoogleSearch, EcommerceReflects real behaviorHarder to mapPath-to-Purchase Metrics
Feel-Think-Do-CareModern AdaptationEmotional brandingBlends logic + emotionStill emergingEmotional Engagement

How to Choose the Right Framework

Choosing the right model depends on your marketing goals, team structure, and where your audience spends time. For content planning, STDC or Feel-Think-Do-Care may be ideal. For lead nurturing, the Buyer’s Journey or 5A model offers more depth. Ecommerce marketers may benefit from the Messy Middle. And for loyalty-driven growth, the Flywheel framework shines.

Final Thoughts

Each customer journey framework brings a different lens to how people discover, evaluate, and engage with brands. Rather than choosing just one, marketers should understand each model’s strengths and apply them where they fit best. Hybrid approaches are not only valid—they’re often necessary in today’s fragmented, cross-channel world.

Navigating the Customer Journey: A Framework Comparison Guide Read More »

bff do i know you animated

Stranger Danger: When Your Business Has Amnesia

Reading Time: 3 minutes

Six common scenarios where your flawed processes and data silos are letting you down

Like most of us, my expectations for a seamless online experience are way higher than what I usually get. Maybe that’s because I’m a marketer—and I see the cracks. But one thing that consistently drives me nuts? Being asked for information I’ve already shared.

It’s like talking to someone who flips between being your BFF and acting like they’ve never met you—sometimes in the same conversation. Two sides of the same coin. And with every interaction, you’re left wondering which side you’ll get.

I experience this most often with forms—digital or paper—but it’s not just about forms. One recent experience got me thinking: how often do businesses unintentionally treat people like strangers, simply because of flawed processes or (data) immaturity?

Scenario #1: The Internal Transfer

A customer has identified themselves and explained what they need — but you have to transfer them to another department.

  • How much of what they shared needs to be repeated?
  • Does the next person know anything about their previous interaction?

Scenario #2: Promoting What They Already Bought

You email or advertise a product to someone who already purchased it or worse, for a better price.

  • Are you showing customers content that’s irrelevant based on their purchase history?
  • Is your marketing team siloed from your sales or product data?

Scenario #3: Asking for Info You Already Have

Your job application form asks the same question twice like about race and being a veteran, or the customer needs to provide their date of birth twice during the prescription pickup process.

  • Do your employees feel confident — and supported — in flagging broken experiences to leadership?
  • Are the cracks in your process starting to leak into the customer experience?

Scenario #4: Stuck in a Shallow Relationship

A repeat customer shows up again — online or in-person — but your team has no context or record of the last interaction.

  • Are you logging key touchpoints across channels?
  • Can your front-line team easily access recent activity or notes?

Scenario #5: The Stranger Danger Re-Targeting

You run retargeting ads or emails that completely ignore someone’s previous actions (e.g., completing a form, talking to sales, booking a demo).

  • Are your campaigns personalized to reflect where someone is in the funnel?
  • Or does every contact get treated like a cold lead and receive the same offering?

Scenario #6: Event Registration Déjà Vu

You ask someone to fill out a long form for an event they’ve attended historically, or you make them re-enter info despite being logged in.

  • Are you recognizing returning attendees?
  • Can you auto-fill or skip unnecessary steps for known contacts?

Final Thoughts

These moments create friction. They subtly erode trust. And they’re often symptoms of data silos, disconnected systems, or outdated processes. Companies dealing with these amnesia moments usually have deeper data struggles beneath the surface.

Bottom line? You need to start somewhere. Tackling a few easy wins can build momentum, earn internal support, and show customers you’re serious about creating a better experience. Then, take on the issues that are the most annoying — and the most costly — because of the experience they deliver.

The good news? These are fixable. But you can’t fix what you don’t notice. Try walking through your own customer journeys like a secret shopper. Review form flows, transfers, and outreach campaigns with fresh eyes. Ask your team: “Would I be frustrated here?”

So how does your company do? Are you staying on the BFF side of the coin — or leaving customers feeling like strangers?

Stranger Danger: When Your Business Has Amnesia Read More »

owala marketing five cs analysis

Marketing 5 C’s Analysis for Owala Water Bottles

Reading Time: 3 minutes

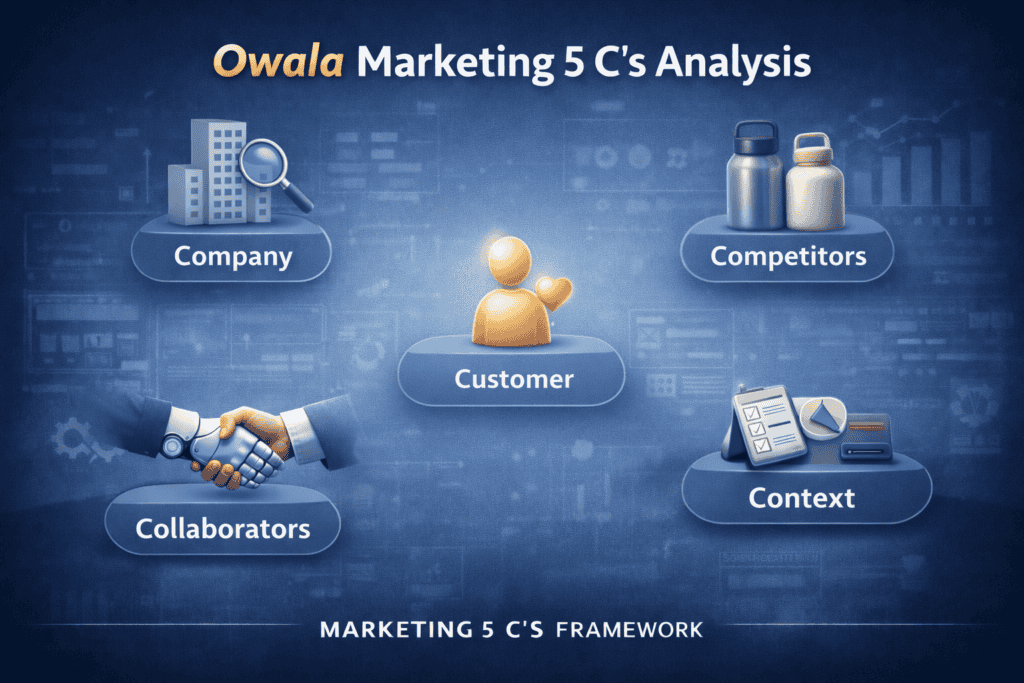
Similar to the Owala SWOT analysis I previously performed, this article evaluates the Owala brand using the Marketing 5 C’s framework:

  • Company
  • Customer
  • Collaborators
  • Competitors
  • Context

Often, there were items from the SWOT analysis that could also have been added to the 5 C’s, but those were largely ignored to avoid repetition and redundancy. The Marketing 5 C’s framework provides a comprehensive view of a brand’s internal and external environment, offering actionable insights for growth and strategic positioning. By applying this framework to Owala, we can better understand their strengths, weaknesses, and the opportunities and threats they face in the competitive reusable drinkware market.

I chose Owala for this analysis because they are an exciting, fast-growing brand that stands out with innovative product designs. Plus, as a Utah-based company, they represent a local success story that is making waves in the competitive reusable drinkware market.

1. Company

Strengths:

  • Clear brand identity focused on making life easier and more enjoyable.
  • Strong product positioning against competitors like Stanley—offering designs that are neither overkill nor underwhelming.
  • Innovative product features (e.g., FreeSip technology) that differentiate Owala in a crowded market.
  • Playful and bold brand voice resonates with their target demographic, especially through creative product names and marketing.

Weaknesses:

  • Newer brand in a saturated market with established competitors like Hydro Flask, Yeti, and Stanley.
  • Faces similar operational challenges (e.g., supply chain risks, international expansion) as other U.S.-based brands.
  • Positioning as a lifestyle brand may alienate more utilitarian consumers seeking no-frills, functional designs.

2. Customer

Strengths:

  • Appeals to young, active, health-conscious consumers who value unique, vibrant designs.
  • Positioned to capture trend-focused buyers looking for functional yet stylish drinkware.

Weaknesses:

  • Low customer loyalty—this demographic is easily drawn to the next “cool” product.
  • May struggle to retain customers if product innovation slows or competitors launch trendier designs.
  • Focus on younger consumers may overlook other lucrative demographics (e.g., professionals or older adults)

3. Collaborators

Internal:

  • Innovative R&D team with a track record of creative, user-friendly designs.
  • Company culture reflects its core audience—young, active, and fun—which informs product design and marketing.
  • Innovative culture provides a competitive edge but requires ongoing investment in product development to maintain market leadership.

External:

  • Reliable manufacturing partners in China keep costs competitive, though supply chain disruptions (e.g., due to global events) remain a risk.
  • Potential to deepen relationships with key retailers or collaborate with lifestyle brands to increase market presence.
  • Opportunity to partner with fitness or wellness apps for cross-promotion, especially if pursuing smart hydration products.

4. Competitors

Opportunities:

  • Continue innovating to stay ahead of copycat products (e.g., enhancing FreeSip or developing new technologies).
  • Explore new customer segments (e.g., athletes, environmentally conscious consumers, older demographics).
  • Expand through new retail partnerships and international markets.
  • Tap into corporate gifting and custom branding for business clients, similar to competitors like Yeti.

Threats:

  • Highly competitive and saturated market where new entrants can quickly gain traction.
  • Larger competitors (e.g., Yeti, Stanley) have stronger brand equity and resources for rapid innovation and distribution.
  • As brand awareness increases, the risk of counterfeits and knock-offs also grows.

5. Context

Opportunities:

  • Capitalize on smart hydration trends—develop smart bottles that sync with health apps.
  • Align with sustainability movements by emphasizing reusable, eco-friendly materials.
  • Communicate ethical sourcing and fair labor practices to align with consumer demand for transparency.

Threats:

  • Navigating strict compliance with FDA regulations and BPA-free standards.
  • Consumers demand safe, durable, and sustainable products—any perceived compromise could harm brand trust.
  • Changing consumer preferences, such as a shift toward minimalism or multi-use products, could challenge Owala’s vibrant, design-first approach.

Marketing 5 C’s Analysis for Owala Water Bottles Read More »