In the past, analyzing customer comments and reviews was hit-or-miss at best.
Early sentiment analysis tools often misread the emotional tone of unstructured text, especially when confronted with nuance. Sarcasm could be mistaken for sincere praise, and industry-specific terms could trigger false alarms. For example, insurance feedback might mention a “total catastrophe” or “flood loss” – terms that sound negative – even when the customer’s actual sentiment about their agent was positive.
Today, thanks to advances in artificial intelligence (AI), we can finally more reliably categorize unstructured sentiment data, grasping the true intent behind words.
The Challenge with Unstructured Sentiment (Before AI)
Human language is complex, and understanding sentiment isn’t as simple as counting positive or negative words. Some of the biggest hurdles historically included:
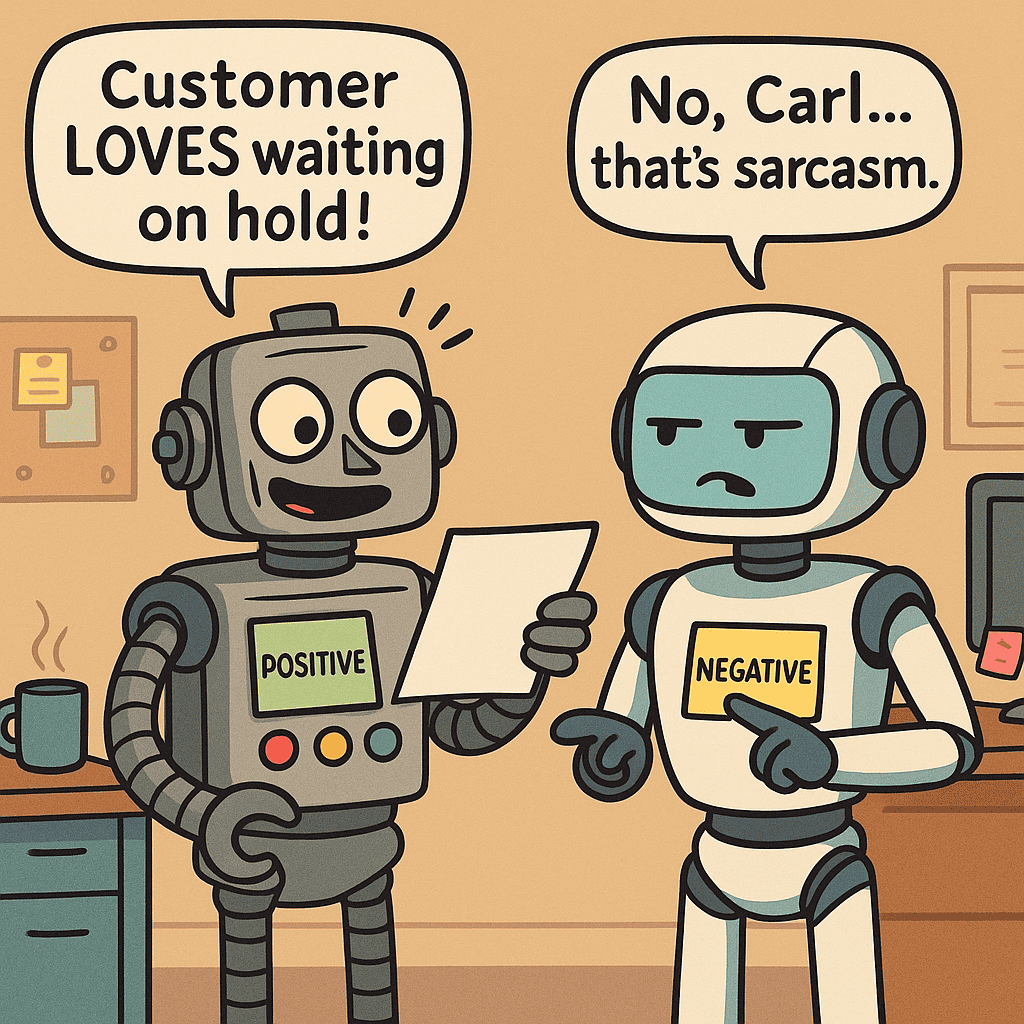
Sarcasm and Irony: Sarcasm flips language on its head – “I just love being on hold for an hour,” one might say, meaning the opposite. Older sentiment algorithms struggled with this. They took words at face value, so positive words in a sarcastic sentence could trick them into a positive classification when the sentiment was actually negative. Likewise, genuinely appreciative comments with a few “negative” words (e.g. “our agent was a lifesaver during this total catastrophe”) could be mislabeled as negative. Without understanding context or tone, these tools were easily foiled by irony and sarcasm.
Domain-Specific Language and Ambiguity: Words mean different things in different contexts. A phrase that sounds negative in one industry might be neutral or positive in another. Sentiment analysis has long been domain-dependent – the same words or expressions can indicate opposite sentiments in different domains. For instance, calling a video game “sick” is praise (slang for “awesome”), but a naive model might flag it as negative (thinking “sick” = ill/bad). Similarly, insurance or disaster-relief contexts include words like “damage,” “loss,” or “catastrophe” which describe events, not customer satisfaction.
Limited Context Understanding: Older approaches often relied on simple rules or keyword lists. They struggled with negation (“not bad at all” could be misread as negative due to the word “bad,” when the sentiment is mildly positive). They also analyzed each sentence in isolation, missing the broader context that humans use to interpret meaning.
These challenges left marketers and analysts with unreliable results – sarcastic complaints tagged as positive sentiment, mixed messages, and the need for manual review. Fortunately, AI has turned this around.
How AI Transformed Sentiment Analysis
Modern AI-driven sentiment analysis isn’t your 2010s “bag-of-words” algorithm. It’s far more sophisticated, which means far more accurate. Here’s what changed and why sentiment categorization is now markedly better:
Context is King: Today’s AI language models analyze text in context, not as isolated words. They evaluate the entire sentence (or even multiple sentences) to derive meaning. This means they catch nuances like negation and tone shifts.
Advanced NLP Techniques: Breakthroughs in deep learning – particularly transformer-based models – have given sentiment analysis a giant leap forward. These models “read” text in a human-like way, considering nuance and even world knowledge.
Learning from Huge Data (including Sarcasm and Slang): Modern AI is trained on vast amounts of text – from tweets and reviews to discussion forums. This exposure means the AI has “seen” countless examples of sarcasm, slang, and domain-specific usage.
One additional factor: cutting-edge sentiment tools can be fine-tuned to specific industries or contexts, allowing them to accurately interpret language that general models would still get wrong.
What AI Still Gets Wrong
Modern sentiment tools are dramatically better, but not infallible. A few limitations worth knowing:
Confidence matters: Good sentiment tools return a probability score, not just a label. If your tool isn’t surfacing confidence levels, you’re missing important signal about when to trust the output and when to take a second look.
Mixed sentiment: “The food was amazing, the service was a disaster” often gets flattened to a single label. Nuanced, multi-topic feedback still trips up many models.
Subtle sarcasm in short text: The same research on sarcasm detection that AI proponents cite also shows LLMs still require multi-step reasoning to reliably catch it. Short social posts remain harder than longer reviews.
Niche and low-resource domains: Fine-tuning helps, but models trained on general text can still misread highly specialized industry language they haven’t seen enough of.
Domain Adaptation and Customization: Cutting-edge sentiment tools can be fine-tuned to specific industries or contexts, allowing them to accurately interpret unique industry language.
Real-World Examples: Old vs. New Sentiment Categorization
Comment
Old Approach Sentiment
Modern AI Sentiment
“I absolutely loved waiting an hour on hold.”
Positive (misread literally)
Negative (sarcasm detected)
“Great job, team. You broke it again.”
Positive (misread “great”)
Negative (clearly sarcastic)
“Just perfect… now nothing works.”
Positive (focus on “perfect”)
Negative (understood irony)
“Thanks a lot, now I’m locked out of my account.”
Positive (saw “thanks”)
Negative (understood frustration)
“Yeah, everyone loves seeing errors first thing in the morning.”
Positive (misled by “loves”)
Negative (sarcasm about errors)
“Oh great, another meeting that could have been an email.”
Positive (misread “great”)
Negative (weary sarcasm)
“Our house was destroyed in a flood – a total catastrophe – but our agent was incredible through it all.”
Negative (keying on “catastrophe”)
Positive (praise for the agent)
“My car was totaled, yet the claims process was fantastic.”
Negative (focus on “totaled”)
Positive (satisfaction with service)
“This party was sick!”
Negative (took “sick” literally)
Positive (understood slang for “amazing”)
“Not bad at all for a Monday.”
Negative (saw “bad”)
Positive (recognized the negation as a mild praise)
Table: Ten example comments that would confuse old sentiment analysis but are correctly understood by modern AI. The old approach often relied on literal word sentiment, while new AI models grasp context, sarcasm, and slang to infer the true tone.
Why This Matters for Marketing and CX Professionals
You Get True Customer Insights: Sarcasm, jokes, and snarky comments won’t fly under the radar as false positives. Your Voice of Customer analysis becomes trustworthy.
Better Decision-Making: You can measure sentiment trends with confidence, making your reports actionable and reliable.
Adaptability Across Channels and Industries: Whether it’s product reviews, support tickets, or survey responses, AI adapts to the context and industry language.
Efficiency Gains: Teams no longer need to manually re-read comments to detect misclassifications, enabling faster action on real sentiment trends.
If your current sentiment tool only returns a positive or negative label with no confidence score attached, that’s the first thing worth re-evaluating.
Conclusion: From Hit-or-Miss to a Genuinely Useful Signal
We’ve entered a new era where unstructured sentiment data – the messy, honest, and nuanced text that customers produce – can be analyzed with a level of accuracy that was unheard of a few years ago. The tools have gotten genuinely good. But “genuinely good” isn’t the same as “done.” Mixed feedback, niche language, and short sarcastic posts still require human judgment to interpret correctly. The right frame isn’t that AI has replaced the analyst – it’s that AI has made the analyst’s job more tractable. You’re no longer drowning in manual review. You can now focus your attention where the signal is ambiguous rather than spending it on the obvious cases.
For marketers, customer experience professionals, and anyone working with feedback or social data, this is a game-changer. You can now take the pulse of customer sentiment with confidence, knowing that the insights reflect reality. AI has finally made the voice of the customer readable at scale – even when customers are being sarcastic, indirect, or industry-specific.
Website analytics are only as good as the story they tell. If your dashboard just shows ‘posts’ and ‘pages,’ you’re missing the real insights about which content formats actually win. While that may be technically accurate, it isn’t particularly helpful when you want to evaluate which parts of your content strategy are actually working.
That’s where categorizing your pages by type comes in. Instead of treating everything as a “post” or “page,” you can create meaningful groups that reflect your actual content strategy. For my website, this includes book summaries, tools, case studies, and more. This makes your analytics far more actionable.
Example: Understanding Content Performance with Page Types
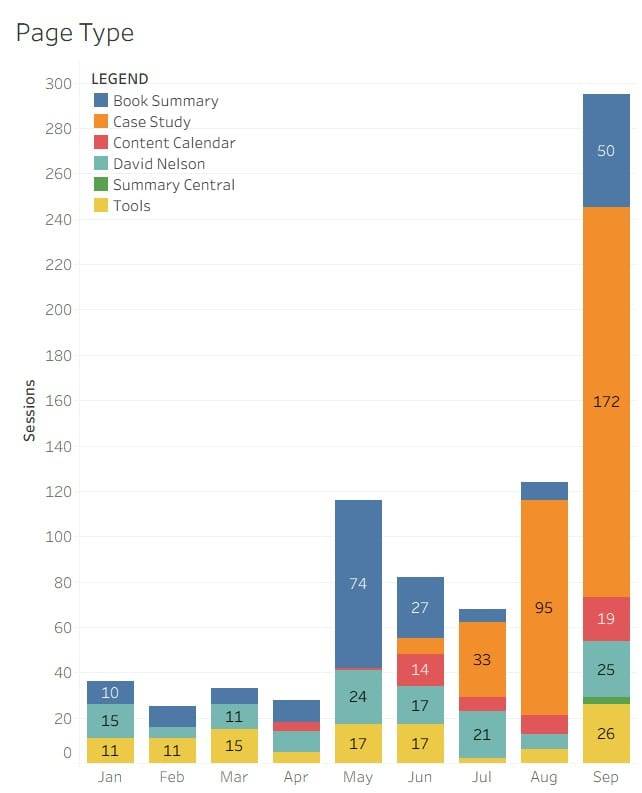
Take a look at the chart below:
At first glance, this view of traffic by page type makes it obvious which categories are performing. For my site, Case Studies have become the breakout performers, driving consistent growth in sessions throughout the year.
Without this level of categorization, I’d just see a long list of URLs making it much harder to recognize that case studies are pulling in the most readers.
Going Beyond Traffic: Measuring Engagement
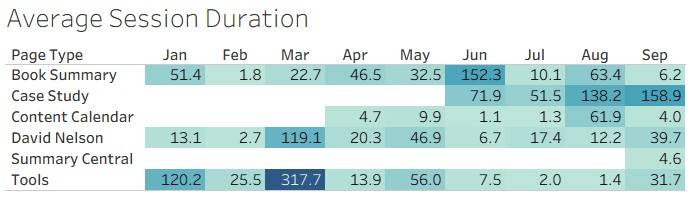
Traffic tells only part of the story. That’s why I also look at average session duration by page type:
Here, the data shows that people are spending more time on my case study pages compared to other types of content. That makes sense, these are longer form, research driven posts. But the key takeaway is that my readers are actually engaging with them, not just clicking in and bouncing out.
This insight helps me decide where to invest more time or at least confirm my reader’s interests.
Why This Matters for Marketers
Categorizing your content into meaningful page types unlocks three major benefits:
Clearer performance insights , You’ll quickly see which content types drive the most traffic.
Better engagement metrics , You can measure not just visits, but whether people are actually engaging with the format.
Smarter resource allocation , Instead of guessing, you’ll know exactly which kinds of content deserve more of your effort.
The Bottom Line
If you only look at your website through the default “posts” and “pages” lens, you’re missing the real story. By categorizing your content by page type, you can easily spot which areas are winning, how readers engage differently with each format, and where to focus next.
For me, the lesson was clear: case studies are my most valuable content type right now. And that clarity only came from taking the extra step to classify my pages in a way that actually reflects my content strategy.
If you haven’t looked at your website analytics this way before, start by grouping your content into a handful of meaningful page types. It’s a simple step that can reveal surprising insights about your audience and your strategy.
Caesars Entertainment, historically known as Harrah’s, pioneered a data-driven loyalty strategy that used customer insights to personalize offers and service across gaming, hotel, dining, and entertainment.
Rather than compete with flashier resorts, the company built a unified view of the guest, tested targeted incentives, and scaled what worked.
The result was higher retention, greater share of wallet, and a loyalty platform that became a durable competitive moat.
This case shows how customer insight, experimentation, and thoughtful personalization can outperform spectacle while respecting customer comfort and privacy.
Company Involved
Caesars Entertainment (originating as Harrah’s, where the loyalty and personalization playbook began)
Marketing Topic
Personalization
Customer Experience
Loyalty Strategy
Public Reaction or Consequences
Customers adopted the program at scale and responded to relevant perks, which deepened loyalty and cross-property engagement. Industry press and business schools highlighted the approach as a model for turning data into measurable marketing impact. Caesars also discovered that personalization has limits. When interactions felt overly intimate, some guests perceived it as intrusive. The company pulled back those touches and emphasized transparency and comfort. Overall, the program delivered strong business results while reinforcing that trust is foundational to long-term loyalty.
Why It Matters Today
• Customer insight plus experimentation can beat expensive acquisition tactics.
• A unified profile enables targeted incentives that lift incremental behavior.
• Personalization works best with clear value exchange, consent, and restraint.
• The playbook endures. Caesars continues to evolve personalization with mobile experiences and AI while keeping loyalty at the core.
3 Takeaways
1. Build a single view of the customer across all touchpoints and measure lifetime value, not one-off transactions.
2. Test everything. Use experiments to find the right offers for the right segments and scale only the winners.
3. Personalize with care. Aim for relevance that feels helpful, not invasive. Protect privacy and give customers control.
Notable Quotes and Data
“When your loyalty card is listed in someone’s obituary, I would maintain you have traction.” Gary Loveman on the depth of loyalty created by the program.
A mid-decade analysis reported Caesars increased its share of customer gaming spend from roughly 36 percent to about 45 percent after scaling its loyalty and data strategy.
Modern tests with AI optimized campaign language and lifted email engagement by double digits, signaling ongoing gains from iterative personalization.
Full Case Narrative
Background and context. In the 1990s and early 2000s, Harrah’s did not compete on mega-resorts or grand spectacles. Guided by Gary Loveman, the company chose to compete on analytics, loyalty, and service. A unified program captured play, stay, dining, and entertainment behaviors and tied them to a single customer identity. The move reframed marketing from giveaways to evidence-based incentives that influenced behavior.
What the company did. The team built a nationwide loyalty program, later known as Total Rewards, to enroll guests at every property and earn points across the portfolio. Data revealed that consistent mid-tier guests drove the majority of revenue. Caesars tested targeted offers for segments and measured lift against controls. Modest, well-aimed incentives often beat expensive bundles. The program encouraged cross-property travel by honoring tiers and benefits everywhere, increasing visit frequency and total enterprise value.
Why they did it. Competing on amenities was costly and easy to copy. Caesars focused on profitable customer behavior. By quantifying theoretical worth and measuring response to offers, marketing spend moved from guesswork to return on investment. The unified program unlocked cross-sell opportunities and created switching costs as members accrued status and points they did not want to abandon.
What happened next. Results included higher retention, more cross-property visitation, and a clear share-of-wallet lift. The database became a strategic asset that shaped acquisitions and integrations. Later, as the company rebranded as Caesars Entertainment, the loyalty platform remained central. The program was renamed Caesars Rewards and continued to grow to tens of millions of members worldwide.
Reflection and analysis. The playbook worked because it combined strong data foundations, a culture of experiment and learn, customer-centric service, and disciplined ROI. The company also learned the boundary between helpful and creepy. Personalized touches that referenced sensitive history were toned down in favor of value-forward, opt-in experiences. In the 2010s and 2020s, Caesars extended the model through mobile messaging, a virtual concierge, and AI-assisted creative testing, showing that the core strategy adapts as channels and tools evolve.
Timeline
• Late 1990s to early 2000s: Harrah’s scales a nationwide loyalty program, later branded Total Rewards. A test and learn culture takes hold.
• Mid 2000s: Acquisition of Caesars accelerates portfolio reach. Loyalty and analytics expand across more properties with measurable share-of-wallet gains.
• 2010: Corporate name changes to Caesars Entertainment. Loyalty strategy remains core.
• 2019: Total Rewards rebrands to Caesars Rewards and continues global expansion.
• Late 2010s to 2020s: Mobile, virtual concierge, and AI-assisted optimization extend personalization while loyalty stays central.
What Happened Next?
Caesars Rewards remains the connective tissue across casinos, hotels, and entertainment brands, encouraging members to keep activity within the network. New channels and capabilities have been layered onto the same foundation. The company positions personalization as a value add and continues to calibrate for comfort, clarity, and trust in an era of stronger privacy expectations.
One Sentence Takeaway
Caesars showed that the safest bet is not a bigger spectacle but smarter personalization that earns loyalty, grows lifetime value, and respects the customer.
In the late 1990s, Amazon.com transformed online shopping by introducing a personalized recommendation engine that suggests products based on each customer’s behavior.
This “Customers who bought X also bought Y” approach revolutionized eCommerce, making it easier for users to discover products and for Amazon to increase sales. Over the years, Amazon’s AI-driven recommendations became increasingly sophisticated, contributing up to 35% of the company’s revenue.
This case study examines how Amazon’s recommendation strategy evolved through innovation and trial-and-error, the public’s reaction including a notable controversy, and the lessons modern marketers can learn about personalization, data, and trust.
Company Involved
Amazon.com is the Seattle-based eCommerce and cloud computing giant founded by Jeff Bezos in 1994 and known for its customer-centric ethos and relentless innovation in online retail.
Marketing Topic
Personalization
Customer Experience
Data Ethics
Public Reaction or Consequences
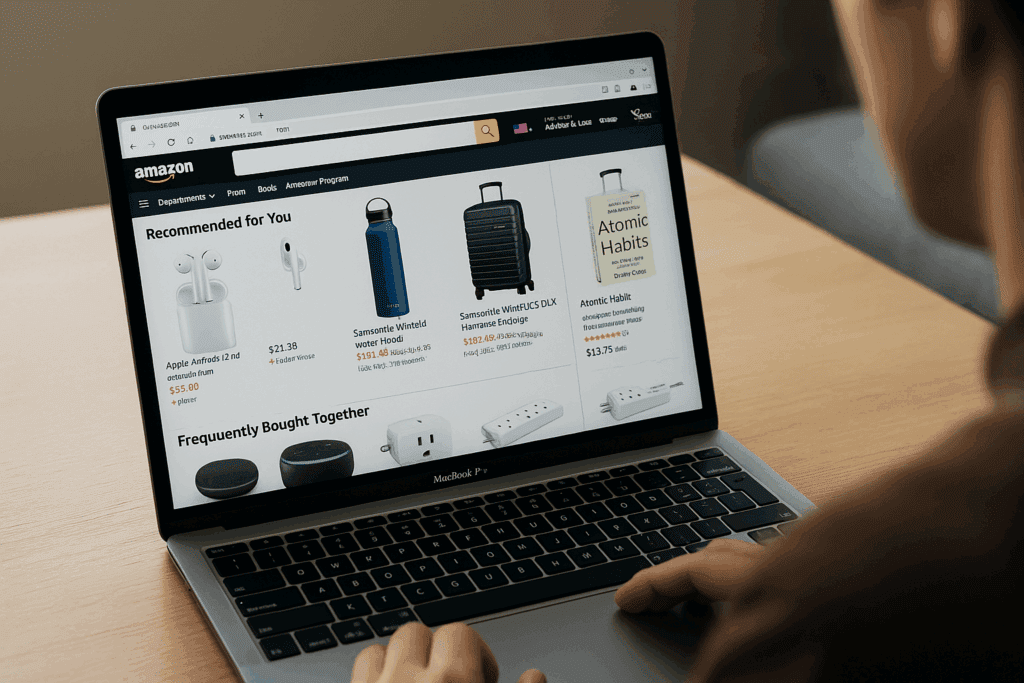
Overall, customers have embraced Amazon’s recommendations as a convenient way to discover new products. The personalized suggestions, from “Frequently Bought Together” add-ons to “Recommended for You” items, often feel helpful rather than intrusive, and they quietly encourage shoppers to spend more. However, there have been moments of public concern. Some users jokingly share odd or overly personal recommendations on social media, highlighting the creepiness factor when algorithms seem to know too much. Privacy advocates have also questioned how much data Amazon collects to power these features.
A more serious incident occurred in 2017, when Amazon’s algorithm was found suggesting combinations of products that could be used to create explosives after a news investigation in the United Kingdom. The “Frequently Bought Together” feature had inadvertently grouped legal chemical ingredients that, in combination, could form a bomb. This revelation sparked media backlash and raised alarms about the lack of human oversight in algorithmic recommendations. Amazon responded by reviewing and tweaking its recommendation presentation to prevent such dangerous pairings. The company emphasized its commitment to customer safety and noted that all products must comply with applicable laws. While the issue was quickly addressed and did not cause lasting damage to Amazon’s brand, it stands as a cautionary tale of unintended consequences.
Despite isolated controversies, the public’s overall response has been positive. Many consumers now expect personalized recommendations as a standard part of the online shopping experience. Amazon’s success normalized the idea that a retailer knows you well enough to suggest what you might want next. This expectation has since spread beyond Amazon to virtually every major eCommerce or content platform, illustrating how Amazon’s early bet on personalization shaped consumer behavior. The key lesson from public reaction is that useful personalization can delight customers, but companies must be vigilant about privacy, relevance, and appropriateness to maintain trust.
Why It Matters Today
Personalization is now the norm: Amazon’s case cemented personalization as a core marketing strategy. In today’s AI-driven market, customers expect tailored experiences from product recommendations to curated content and companies that deliver relevant suggestions enjoy higher engagement and loyalty. Amazon showed that treating each customer uniquely at scale is possible and profitable.
Data-driven strategy and ROI: This case highlights how leveraging customer data can dramatically improve revenue. Marketers now cite Amazon when arguing for investments in AI and analytics because Amazon’s recommendation engine drives roughly a third of its sales. The case underscores that mining purchase history and behavior patterns ethically can boost cross-selling, upselling, and customer lifetime value.
Balancing personalization with trust: Amazon’s journey is also a lesson in data ethics and algorithm oversight. In an era of GDPR, CCPA, and growing privacy concerns, marketers must ensure personalization does not cross the line into invasiveness or danger. Amazon largely avoided creepy personalization scandals by focusing on helpful use of data, but the 2017 incident showed that even well-intended algorithms need human checks. Modern marketers must combine automation with judgement, ensuring that personalization remains a positive force.
Continuous innovation: Finally, Amazon’s case remains relevant because it is about continuous improvement. From collaborative filtering to neural networks and now generative AI, Amazon keeps evolving its approach. This reminds marketers to stay innovative and adaptive. The tools and techniques for personalization today might change tomorrow, but the goal of delighting the customer remains.
3 Takeaways
1. Personalization pays off: Relevant recommendations can significantly boost sales and customer satisfaction. Amazon proved that tailoring the shopping experience to individual tastes is not just a nice-to-have. It became a competitive advantage that drives 30 percent plus of revenue. Marketers should invest in understanding their customers deeply and delivering the right suggestion at the right time.
2. Test, learn, and iterate: Amazon’s recommendation engine succeeded through constant experimentation and refinement. The team did not get it perfect on the first try. Early features flopped, and even successful algorithms had hidden flaws that were later fixed. The breakthrough came from a culture of A/B testing and data-driven decision-making. Marketers should foster a similar test-and-learn approach, using customer feedback and metrics to guide improvements.
3. Keep customer trust at the center: Personalization should enhance the customer’s experience, not exploit it. Transparency, relevance, and safety are key. Amazon’s misstep recommending bomb ingredients illustrated how automated suggestions can go awry without safeguards. The case teaches that marketing algorithms need ethical guidelines and oversight. When implementing personalization, always ask: Is this in the customer’s best interest.
Notable Quotes and Data
Nearly 35 percent of Amazon’s revenue is generated by its recommendation engine, according to industry research. This oft-cited statistic highlights the massive impact of Amazon’s personalized marketing on its bottom line.
“We will listen to customers, invent on their behalf, and personalize the store for each of them, all while working hard to continue to earn their trust.” Jeff Bezos, Amazon founder, 1999 shareholder letter.
“In my experience, innovation can only come from the bottom. Those closest to the problem are in the best position to solve it.” Greg Linden, early Amazon engineer.
Full Case Narrative
In the mid-1990s, Amazon was a young online bookstore with a bold vision: to become Earth’s most customer-centric company. Founder Jeff Bezos believed the internet allowed each shopper to have a unique, personalized experience, famously saying that if he had millions of customers, he should have millions of different storefronts for them. Early on, Amazon experimented with basic recommendation features to bring this vision to life. The first attempt, a tool called BookMatcher, asked customers to rate books to get suggestions. However, it did not work very well, requiring over 20 ratings to generate any recommendations, which often turned out obvious or off-target bestsellers. The system was also straining under the growing user load. In short, Amazon’s initial foray into personalization was a flop, but it laid the groundwork for something much bigger.
Enter Greg Linden, a young Amazon software engineer with a passion for data mining. In the late 1990s, Linden started a side project to build a better recommendation engine: one that could work quickly with minimal input. He worked in his spare time to prototype a new system called Instant Recommendations. Rather than requiring dozens of explicit ratings, it could make suggestions after just a few purchases or product views. Linden’s prototype was fast and scalable, prioritizing performance so recommendations could be updated in real time. When Amazon undertook a major website redesign, his team with support from a manager named Dwayne polished the interface and slipped Linden’s recommender into production. For a while, the old and new systems ran in parallel, but as expected, Instant Recommendations proved far more useful, and the clunky BookMatcher was soon retired. This bottom-up innovation, developed by an engineer rather than directed by executives, would evolve into the backbone of Amazon’s personalization strategy.
One of the first places Amazon saw a big impact was the shopping cart. Around 1998, Linden had an idea: what if Amazon’s site showed you additional items while you were checking out, based on what is in your cart. Traditional retailers have always relied on impulse buys in checkout lanes, so why not digital recommendations. Linden hacked together a cart recommendation feature and demoed it. Initially, a senior Amazon executive opposed the idea, worrying that suggestions might distract customers from completing their purchase. Undeterred, Linden ran an A/B test to let the data speak. The results were unmistakable: showing recommendations at checkout increased sales by a wide margin. With that evidence, Amazon launched the feature sitewide with urgency. It was an early lesson that smart recommendations could boost revenue without derailing the customer experience. As Greg Linden later noted, sometimes front-line innovation trumps managerial instinct, and you have to trust those close to the data and the customer to experiment.
Behind Amazon’s successful recommendation engine was a technical breakthrough. In the early 2000s, most companies experimenting with recommendations used user-based collaborative filtering, meaning they tried to match you with similar customers and recommend items those people bought. Amazon’s tech team, however, found this approach did not scale well as its customer base grew into the millions. Updating and comparing countless user profiles was too slow and computationally expensive. Instead, Amazon’s engineers flipped the approach to item-to-item collaborative filtering. In simpler terms, the algorithm focuses on the relationships between products, not people. For any given item, Amazon’s system automatically identifies other items that are frequently bought by the same customers. If you buy item A, and a lot of those buyers also bought item B or C, then B and C are related to A in the eyes of the algorithm. By precomputing these item-to-item similarities, Amazon could quickly generate recommendations on the fly by looking at the customer’s current item or recent purchases. This method was far more scalable and often more accurate in producing relevant suggestions. In 2003, Amazon engineers Greg Linden, Brent Smith, and Jeremy York published a paper explaining this item-based filtering approach. Years later, that paper was recognized with a Test of Time award for its enduring influence on the field. The takeaway for Amazon was that a combination of big data and clever math could recreate the personal touch of a sales clerk who knows what shoppers with similar tastes tend to buy.
Of course, the recommendation engine was not perfected overnight. Amazon spent years refining the algorithms to improve quality. One major adjustment, made in the mid-2000s, involved correcting a statistical bias. Originally, the related-item calculations did not account for the fact that some customers just buy a lot of stuff. These heavy buyers could skew the results, making unrelated popular items seem falsely related simply because big spenders happened to purchase many things. Amazon’s data scientists eventually recognized this flaw and tweaked the formula to discount the influence of those high-variance shoppers. This fix significantly improved recommendation relevance. It is a reminder that even successful algorithms need tuning and human vigilance to keep getting better. Amazon’s personalization team continued to add new data signals as well. Beyond just co-purchase patterns, they incorporated browsing history, item ratings, and contextual info like seasonality or trending products. Over time, the recommendations became richer and more multifaceted: not only “customers who bought X also bought Y,” but also “Inspired by your browsing history,” “Recommended for you in category,” and so on. By the mid-2000s, Amazon’s site was practically littered with recommendation widgets, on the homepage, product pages, the cart, confirmation pages, and follow-up emails. This was very intentional. Amazon recognized that every touchpoint was an opportunity to present something the customer might buy, a chance to upsell or cross-sell while genuinely helping the customer discover relevant products. An internal motto emerged: never miss an opportunity to make a helpful recommendation.
The impact of this strategy was dramatic. Amazon realized that recommendations not only increased immediate basket sizes but also improved customer retention. Shoppers who consistently find things that interest them are more likely to return to Amazon for future purchases. Over the years, Amazon has reported that a huge portion of sales comes from these personalized suggestions. Analysts estimate 30 to 35 percent of Amazon’s retail revenue is driven by its recommendation engine. Jeff Bezos once described the effect as accelerating the process of discovery for customers, effectively shortening the time it takes for people to stumble upon something they want. Instead of wandering a physical store or doing broad web searches, Amazon’s algorithms put curated options in front of you. For example, a customer shopping for a digital camera might immediately see recommended accessories like tripods or memory cards, top-rated lenses other photographers bought, or even alternative camera models that are popular. This not only increases the odds of a larger sale, but it also enhances the customer experience by making Amazon feel like a one-stop shop that understands your needs. Over time, Amazon’s personalization grew so sophisticated that it started to feel like the platform was anticipating what you might want next, almost like a knowledgeable store clerk or a friend who knows your tastes. An analysis found dozens of different recommendation slots on Amazon’s homepage app, each tailored with different logic to maximize the chances of conversion. By investing heavily in machine learning, data infrastructure, and experimentation, Amazon built what many consider the gold standard of recommendation systems in retail.
However, even gold standards have their glitches. One prominent hiccup in Amazon’s story came in September 2017. Following a thwarted terror attack in London, reporters discovered that Amazon’s algorithm was bundling bomb-making ingredients in recommendations. For example, if someone added a certain chemical to their cart, the “Frequently Bought Together” section might suggest other chemicals and supplies that, together, could create an explosive. This was an eerie and alarming example of an algorithm simply optimizing for sales without understanding context or appropriateness. The public and media reaction was swift. Amazon acted quickly to remove such combinations and issued a statement underscoring that all products must comply with guidelines and that they were reviewing the site to ensure products are presented in an appropriate manner. The incident highlighted a crucial point: algorithms have no common sense. They will recommend whatever boosts click-through and revenue unless humans set boundaries. For Amazon, it was a reputational scare that fortunately did not escalate. Internally, it likely prompted the team to introduce new safeguards, perhaps filtering out certain products from being recommended together or adding oversight for products with legal or safety implications. The lesson for marketers is clear. When deploying AI and personalization at scale, always consider the edge cases and potential misuse. What makes business sense in aggregate might be problematic in specific contexts.
Meanwhile, Amazon kept pushing its recommendation engine into new realms. As the company diversified into digital content like Kindle e-books and Prime Video, into groceries like Whole Foods and Amazon Fresh, and into voice assistants like Alexa, it brought personalization along for the ride. On Amazon’s video platform, for example, recommendation algorithms suggest what to watch next, much like Netflix. Initially, Amazon’s Prime Video struggled to achieve the same level of finesse in suggestions as its retail store did for products. In 2014, a team in Amazon’s Personalization group began overhauling the Prime Video recommender using deep learning techniques. After several years of research and development, they achieved a breakthrough. In 2019, Amazon’s Consumer leadership announced that a new AI-driven algorithm had delivered a twofold improvement in Prime Video recommendation quality, calling it a once-in-a-decade leap in performance. This showed that even after decades, Amazon is still finding new ways to improve personalization by applying modern neural network models to complement collaborative filtering approaches. Similarly, Amazon’s foray into voice with Alexa opened another front: figuring out how to recommend products conversationally when a user says, for instance, “Alexa, I need some batteries.” By 2020, Amazon even started offering its internal personalization technology as a service to other businesses via AWS Personalize, essentially letting any retailer or app developer use Amazon-like recommendation algorithms without having to build them from scratch. It is ironic and impressive. A tool that began as a secret sauce for selling more books is now a cloud product in its own right.
Through all of this, Amazon has remained laser-focused on the customer. The company’s culture is famously data-driven, but also guided by the principle of earning and keeping customer trust. Amazon’s use of personalization has generally avoided the creepy factor that plagues some others. Amazon achieved this by keeping recommendations mostly on-site or in Amazon-branded emails where they feel like helpful suggestions in context, rather than chasing customers around the web with retargeting ads that feel invasive. They also give users control. Amazon’s site has options to fine-tune your recommendations, remove items from your browsing history, or turn off certain personalized emails. In short, Amazon’s case shows that personalization thrives when it is customer-centric, genuinely enhancing the user’s ability to find what they want, and not just a naked ploy to upsell.
Timeline
1997: Amazon debuts its first recommendation feature, BookMatcher, which suggests books based on user ratings. It struggles due to requiring many ratings and often just recommends popular titles.
1998: Engineer Greg Linden develops a new Instant Recommendations engine as a side project, focusing on speed and minimal input. Amazon launches it during a site redesign, and it soon replaces BookMatcher as the main recommendation system.
1999: Amazon implements shopping cart recommendations, impulse suggestions at checkout. Despite initial internal resistance, an A/B test proves it boosts sales, and the feature rolls out to all customers.
2001: Amazon files a patent for its item-to-item collaborative filtering technology as it refines the algorithm for scalability and relevance. Personalized product recommendations become a key part of Amazon’s site navigation and emails.
2003: Amazon’s Personalization team publishes a paper on item-to-item collaborative filtering. This approach, focusing on product-to-product similarities, allows Amazon to make real time recommendations even with a massive customer base. Years later, the paper is honored as a Test of Time paper for its lasting influence.
Mid-2000s: Ongoing improvements are made to the recommendation engine’s math. The team corrects a bias where heavy purchasers distorted item correlations, leading to a notable quality boost in suggestions. Amazon also expands recommendation widgets across the site and launches “Customers Who Bought X Also Bought Y” and “Frequently Bought Together.”
2010s: Amazon’s growth into new categories sees its recommendation engine applied to music, video, and more. In 2014, Amazon begins using deep learning for recommendations, and by 2019 achieves a major improvement in Prime Video suggestions with advanced AI models. In retail, recommendations continue to drive a significant portion of sales.
September 2017: Controversy. British media report that Amazon’s auto recommendations grouped together ingredients for making a bomb, following a terror incident. Amazon quickly removes the suggestions and updates its algorithms and policies to prevent such combinations. The event draws attention to the ethical design of recommendation systems.
2020 and beyond: Amazon introduces AWS Personalize, offering its recommendation algorithms as a service to other businesses. Personalization remains central to Amazon’s marketing. The company starts using generative AI to create more nuanced, context-aware recommendations and personalized content descriptions. By 2025, Amazon’s personalization spans voice, physical stores, and continues to evolve with new technologies.
What Happened Next
Amazon’s recommendation engine never stopped evolving, and its story is a testament to continuous innovation. After solidifying its dominance in online retail, Amazon’s personalization tactics were emulated by competitors worldwide. Rather than resting on its laurels, Amazon pushed forward on multiple fronts.
Resilience and trust: In the wake of the 2017 bomb-recommendation scare, Amazon took measures to avoid similar incidents. While details are private, the company likely improved its filtering of sensitive items and gave its algorithms context awareness. The quick mitigation helped Amazon maintain customer trust. There was no lasting boycott or regulatory action, partly because Amazon was proactive and because people understood this was a mistake, not malice.
Holistic personalization: Amazon expanded the scope of its recommendation engine beyond just products you might buy. The company realized that personalization could improve the entire customer journey. This includes personalized search results, personalized deals, and personalized content on Amazon’s homepage and marketing communications. By integrating its vast data with machine learning, Amazon created a retail experience that feels uniquely tuned to each user.
From tool to product: A notable next chapter is how Amazon turned its internal capability into a service for others. Amazon Web Services launched Amazon Personalize, allowing developers to plug into Amazon’s recommendation algorithms as an API. Essentially, Amazon is monetizing its expertise in personalization by selling it to third parties who want Amazon-grade recommendations without having to build them from scratch.
Future innovations: As of the mid-2020s, Amazon is infusing AI at an even deeper level into its recommendation systems. The company has spoken about using advanced NLP and generative AI to tailor product descriptions and titles to individual shoppers. They are also exploring multi-modal recommendations, especially as voice shopping grows. The recommendation engine of the future might converse with you via Alexa, or use AR to suggest how furniture would look in your room. The common thread: Amazon never sees personalization as done. It is an ongoing journey, with the next stop being AI that can understand context even better.
Today, Amazon’s marketing and product strategy is inseparable from its recommendation engine. The company continues to achieve strong sales growth and high customer retention, and a lot of that can be credited to the seamless, personalized experience that keeps customers engaged and shopping. Amazon’s recommendation engine, once a novel feature, is now a core part of its brand promise: we know what you like, and we will help you find it.
One Sentence Takeaway
Personalization can be a powerhouse for growth, but only if you continually earn customer trust while using data to genuinely enhance their experience.
Box plots (also called box-and-whisker plots) are powerful tools for visualizing distributions, spotting outliers, and quickly understanding how your data is spread. Here’s how to decode one.
Invented by statistician John Tukey in the 1970s, box plots — also known as box-and-whisker plots — offer a compact way to visualize the distribution of data. Whether you are analyzing website behavior, survey results, or scientific measurements, a box plot helps you quickly see the center, spread, and any unusual values in your dataset.
In this post, we will walk you through how to read a box plot step-by-step using real sample data, and explain what each component — from the box to the whiskers to the outliers — really means.
What Is a Box Plot?
A box plot summarizes five key numbers, sometimes called the five-number summary from a dataset:
Minimum
First Quartile (Q1)
Median (Q2)
Third Quartile (Q3)
Maximum
It also highlights outliers — extreme values that fall far outside the typical range.
Why Use It?
Box plots are useful because they:
Show the spread and central tendency of data
Reveal outliers that could skew averages
Let you compare distributions across groups at a glance
Reading a Box Plot Example
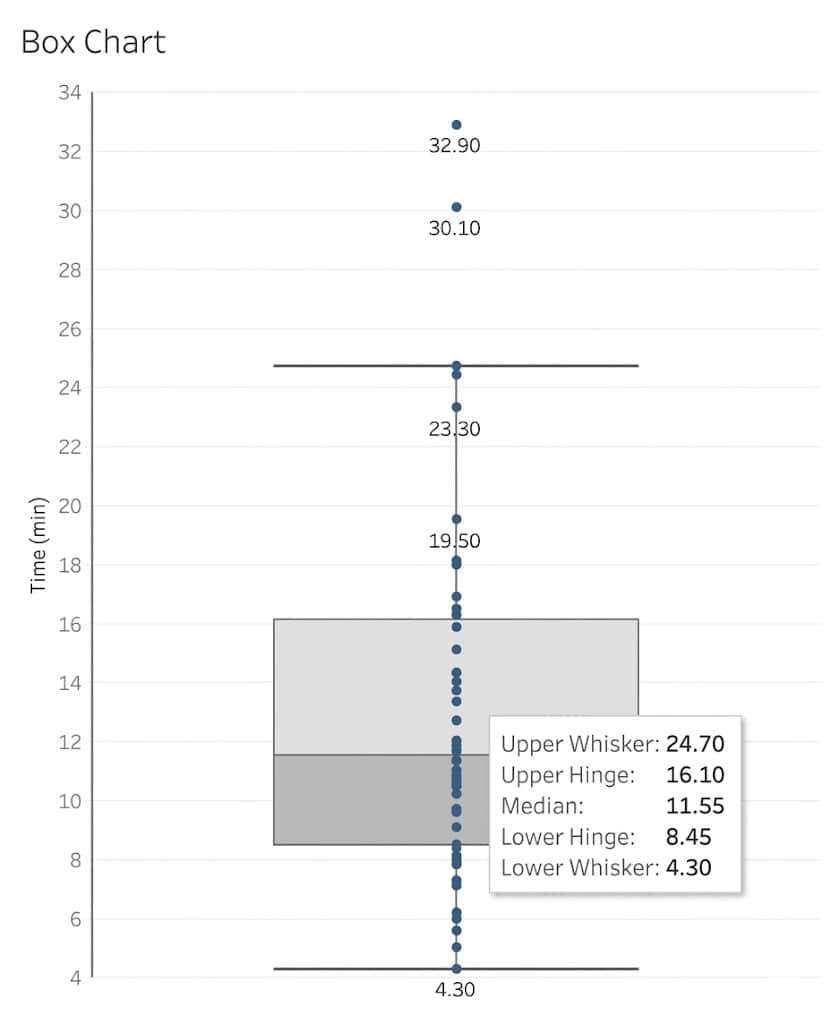
The graph below is based on how much time each customer spent browsing on the Acme Inc website. There are 50 customers represented in the dataset.
The Box (Middle 50 Percent): The shaded box spans from Q1 = 8.45 minutes to Q3 = 16.10 minutes. This means half of all shoppers spent between 8.45 and 16.10 minutes browsing.
The Line Inside the Box (Median): The horizontal line within the box is the median value (Q2). In this case, the median is 11.55 minutes — half of all observations fall below this value, and half above it.
The Whiskers: The lines extending from either side of the box are called whiskers. These represent the range of data that falls within 1.5 times the interquartile range (IQR). The lower whisker reaches down to 4.3 minutes, and the upper whisker stretches to 24.7 minutes.
The Outliers: Any values beyond the whiskers are plotted as individual points. In this dataset, two customers spent an unusually long time on the site — 30.1 and 32.9 minutes — and are considered outliers.
How Were the Outliers Calculated?
To find outliers and build a box plot, we first need the IQR (interquartile range):
Any values above 27.575 or below -3.025 are considered outliers. Since two customers spent 30.1 and 32.9 minutes on the site — well above the upper fence — they are flagged as outliers.
What This Tells Us
The box plot reveals several key insights:
Most customers spend between 8 and 16 minutes browsing.
The typical session length (median) is 11.5 minutes.
A small number of users spent over 30 minutes on the site — well beyond normal behavior.
This visual summary is far more powerful than a simple average. It helps marketers and analysts quickly spot patterns, design better experiences, and make data-driven decisions.
Final Thoughts
Box plots may look simple, but they tell a rich story. Whether you are in marketing, UX, analytics, or research — being able to read a box plot gives you a clear edge. It is a fast way to summarize large datasets and zoom in on what really matters: the center, the spread, and the surprises.
In the world of data visualization, no chart type has endured more ridicule than the pie chart. “Hate” might sound extreme, but not when you’ve seen pie charts with legends longer than your arm. The human brain struggles to compare slices, especially when there are more than five. And no, turning your pie chart into a donut doesn’t solve the problem.
As a quick aside, I’d argue there’s one chart worse than the pie: the 3D chart. Thankfully, they’ve mostly faded from use. When they do appear, Excel is usually the culprit, since most modern BI tools have banned this visual crime. The 3D chart feels like a relic of the ‘80s, when we thought holograms were the future (remember Jem and the Holograms?). Not everyone has moved on.
But there’s another chart type that deserves scrutiny—and it’s not even a chart.
Enter: the snapshot.
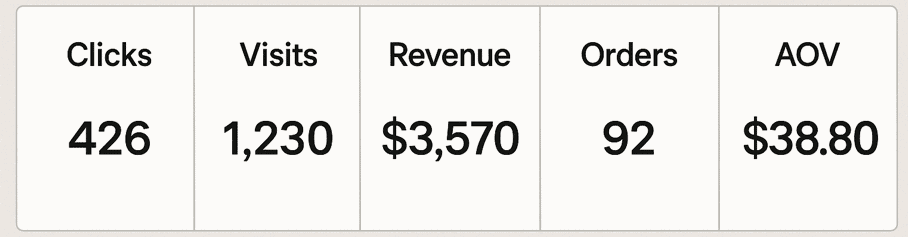
You’ve seen them. A single number in a tidy little box: Clicks. Revenue. Orders. AOV. Just a figure, standing alone like it says everything. But numbers without context don’t tell the full story. In fact, they can mislead.
Let me explain with a personal story.
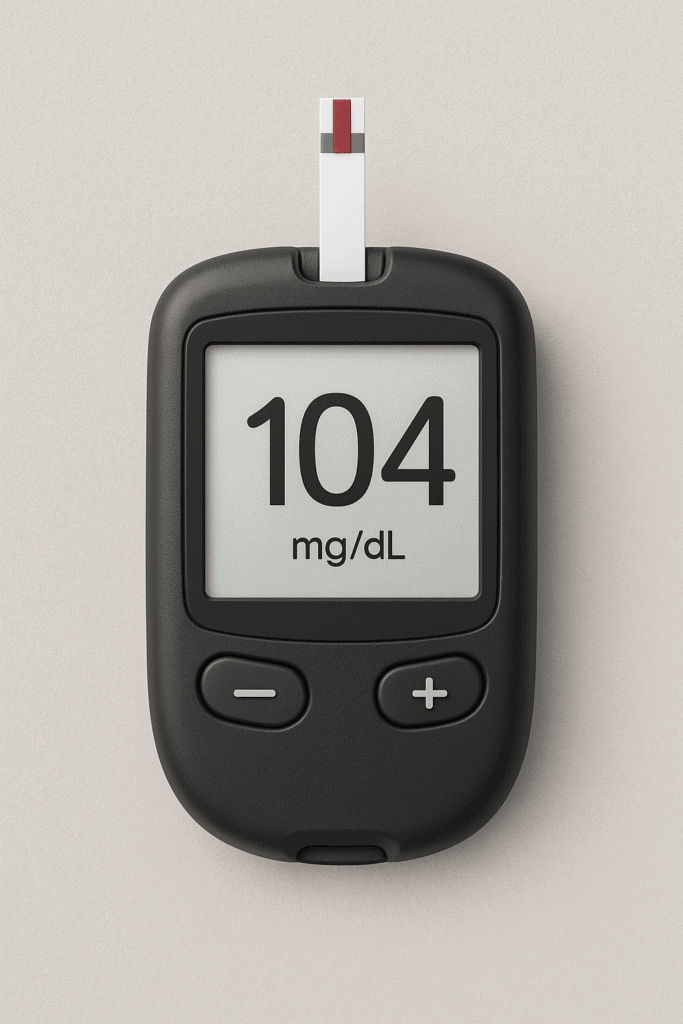
My oldest daughter was diagnosed with type 1 diabetes at just 15 months old. Overnight, our lives changed. At that time, the only way to monitor her blood sugar was through a finger poke. The meter might read “104,” which sounds great. But without context, that number raised more questions than answers. Was she rising fast or crashing hard? Had the insulin taken effect, or was the food still digesting?
Back then, we didn’t have the continuous feedback loop a Dexcom now provides. Just snapshots. Her mom would check her repeatedly throughout the night to avoid dangerous highs or the terrifying lows that once led to a seizure. We had numbers—but not the story behind them.
That’s the danger with snapshots in dashboards, too.
The most common question they provoke: “Is that good or bad?”
If your dashboard is for an audience deeply familiar with the data, a snapshot might work. But if you’re building for an executive team—or anyone less immersed—you need more context. What’s normal? What’s the trend? Are we up, down, or flat?
Dashboards often sacrifice depth for space, so these horizontal bars of data seem efficient. I’ve created plenty myself. But just like that blood sugar reading, the number alone isn’t enough.